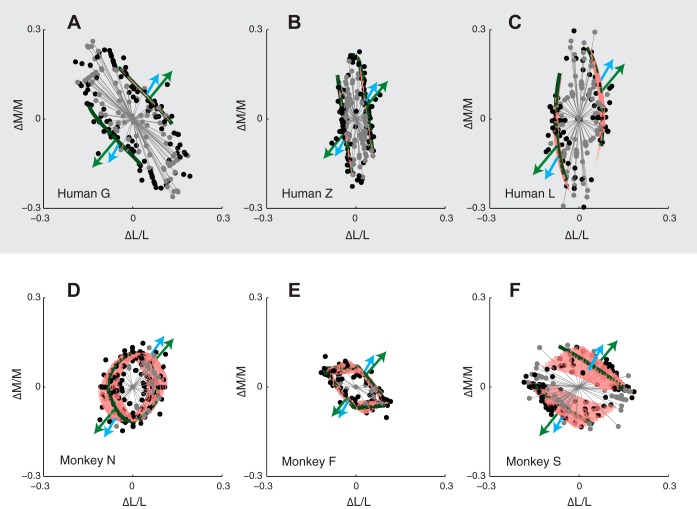
Fig. 4.
Isodetectability surfaces in cone contrast space for three human (A–C) and three monkey (D–F) observers. Individual threshold measurements are represented as black dots, and fitted surfaces are shaded red. Gray lines and points indicate color directions in which thresholds were unmeasurable. Green and blue arrows show the color directions of the green and blue phosphor modulations, respectively. Dark green contours show the intersection of the isodetectability surface and the LM plane.

