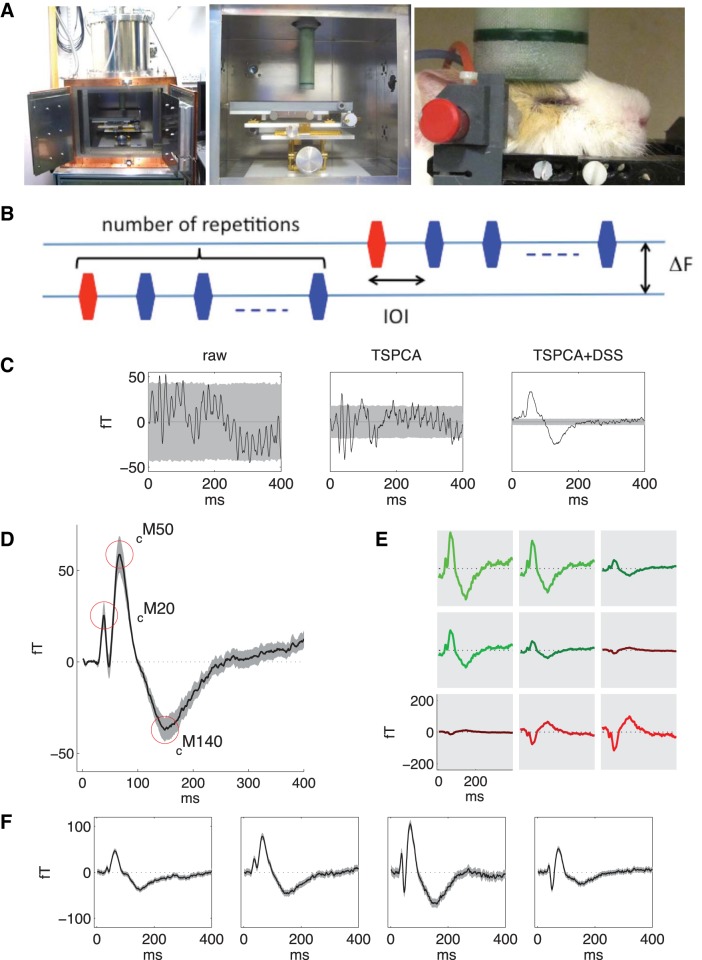
Fig. 1.
Brain responses to tone pips in the guinea pig, as measured noninvasively with small-animal magnetoencephalography (MEG). A: MEG experimental setup. Left, view of the small-animal MEG machine with the helium dewar visible on top of the recording chamber. Middle, close-up view of the recording chamber, with the adjustable platform for the animal below the extremity of the dewar containing the MEG sensors. Right, an anesthetised guinea pig with its head resting on the head holder and the dewar containing MEG sensors pressed lightly on the dorsal surface of the head. Plastic tubing held in place near the ears is attached to speakers outside the recording chamber, so that acoustic stimuli can be delivered directly into the auditory canal. B: in the roving standard paradigm, a series of tones of the same frequency and at the same interonset interval (IOI) is followed by a series at a new frequency separated by ΔF, with possibly a different IOI and number of tone repetitions in the series. The initial tone in each series (red) acts as a deviant stimulus compared with the standard stimuli of remaining tones in the series (blue). C: individual channel waveforms evoked by a 3.2-kHz tone. Left, mean raw waveform averaged over ∼14,000 repeats; gray shading indicates bootstrapped SD in the mean (equivalent to SE here; bootstrap used for consistency with other analyses). Middle, waveform after time-shift principal components analysis (TSPCA), which removes environmental noise such as 50-Hz or machine-induced magnetic fields. Right, waveform after TSPCA and denoising source separation (DSS; see methods). The first DSS component (the most reliable linear combination of channels) was backprojected into the sensor space to produce the denoised auditory evoked field (AEF). D: population average AEF for the 3.2-kHz tone, averaged across all tone presentations and all 9 animals used for experiments of response adaptation. The amplitude was calculated as the root mean squared amplitude across sensors. The shaded region indicates a bootstrap estimate of 1 SD around the population mean (i.e., SE). The guinea pig AEF was characterized by three extrema, with latencies of 10–30 ms (cM20), 25–75 ms (cM50), and 100–175 ms (cM140) relative to the stimulus onset (see methods). E: spatial variation in AEF for one animal, illustrated by backprojecting the first DSS component into the sensor space for all nine sensors. The color indicates waveform polarity; the arrangement of plots reflects the arrangement of the nine magnetometers in the sensor array. F: AEFs for responses to a 30-ms, 3.2-kHz tone pip from four different animals used for experiments of response adaptation. Responses are averaged across both standard and deviant conditions, with shading indicating bootstrapped SD of the mean. These results demonstrate the consistency of MEG responses both within and across animals.

