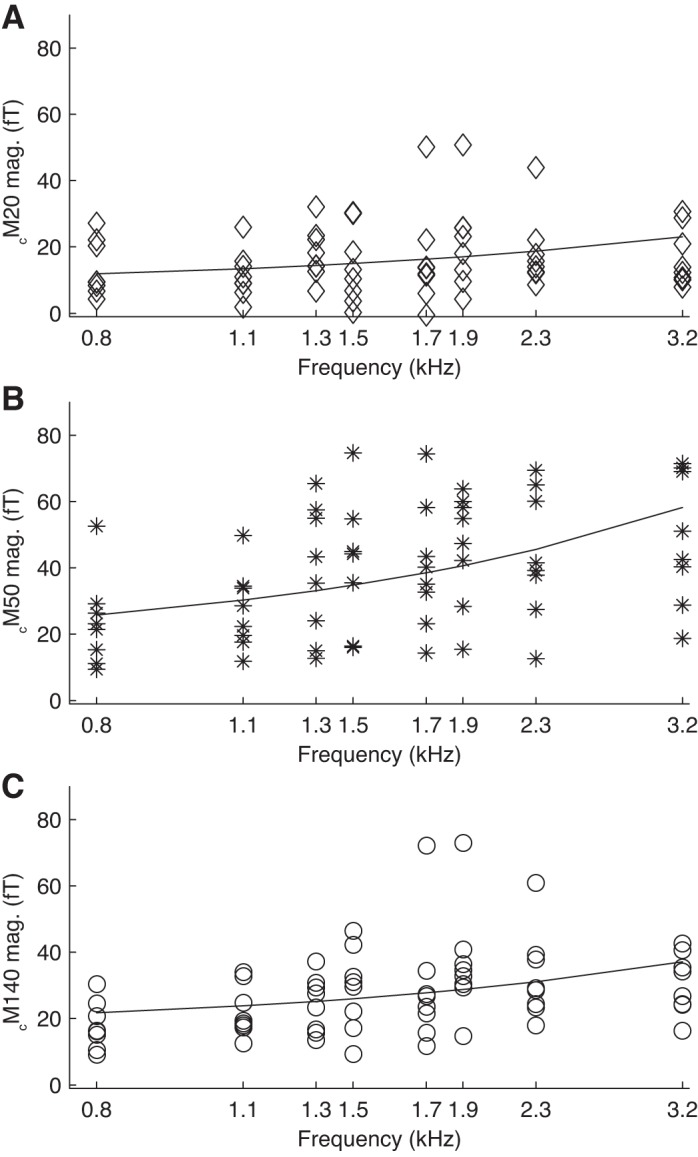
Fig. 2.

Magnitudes of AEF extrema as a function of tone frequency. The magnitude (absolute value of response amplitude) of each of the AEF extrema increased with increasing frequency of the tone pip from 800 Hz to 3.2 kHz. Plots show data from all 8 animals used for basic response characterisation experiments, with linear regression lines (note that abscissa is logarithmic). A: cM20; linear regression 4.6 fT/kHz + 8.2 fT, p < 0.05. B: cM50; linear regression 13.5 fT/kHz + 15.0 fT, p < 0.01. C: cM140; linear regression 6.4 fT/kHz + 16.6 fT, p < 0.01.
