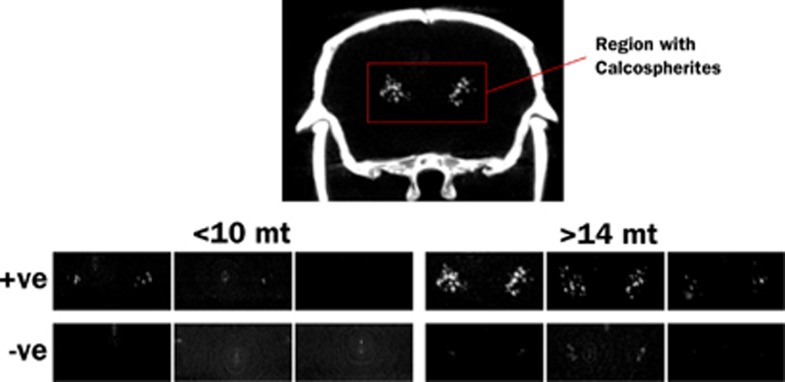
Figure 4.
Maximum intensity projections of computed tomography (CT) images showing the regions where calcospherites are typically observed. Test animals are grouped as younger (<11 months) and older (>14 months), and by APP transgene status (+ve and −ve). Calcospherites were observed in 3/4 APP+ <11Mo, 9/9 APP+ >14Mo, 0/6 APP− <11Mo, and 9/11 APP− >14 Mo mice, and are obviously more intense in older, APP+ mice.

