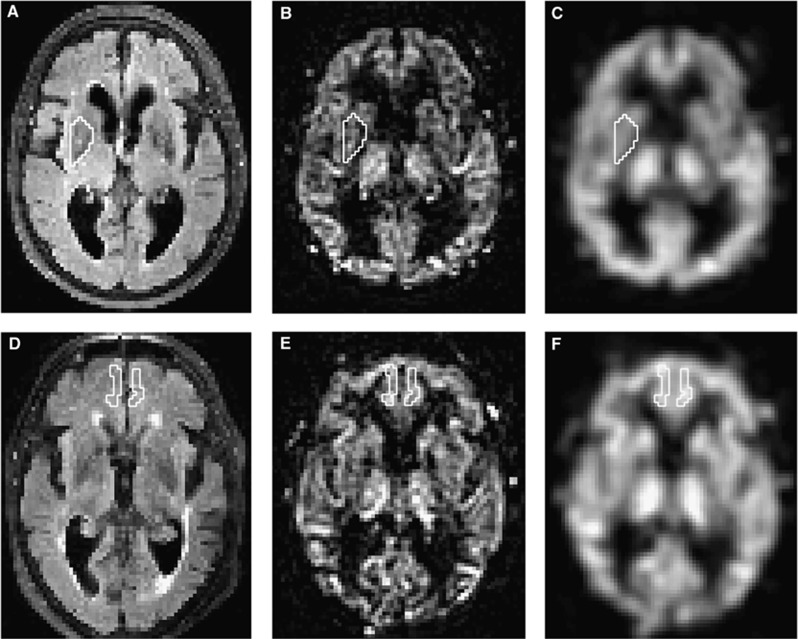
Figure 1.
Example of two ROIs in two different patients. Upper row is an example of the right lentiform nucleus ROI in patient 1 and lower row shows the medial frontal cortex ROI in patient 2. (A and D) FLAIR images that were used to draw the ROIs. (B and E) pCASL perfusion images. (C and F) Smoothed pCASL images that were used to calculate CBF. CBF, cerebral blood flow; FLAIR, fluid-attenuated inversion recovery; pCASL, pseudo-continuous arterial spin labeling; ROIs, regions of interests.

