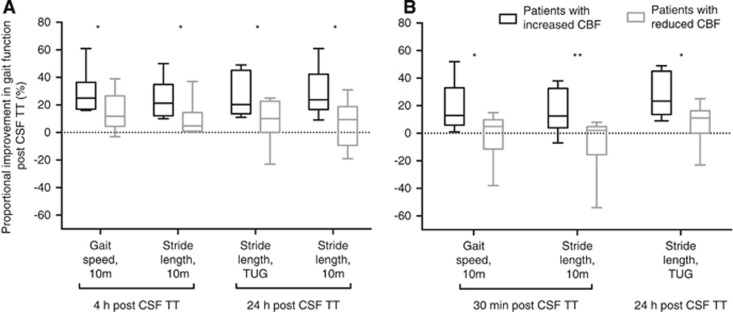
Figure 3.
Differences in proportional gait improvement between patients with an increased versus reduced CBF at different investigation times. The whiskers in the box-and-whiskers graph represent maximum/minimum. (A) Frontal white matter. (B) Lateral white matter. CSF TT, cerebrospinal fluid tap test; 10 m, 10 m walking test at maximum pace; TUG, timed ‘up and go'. Significant difference: *P<0.05; **P<0.01.

