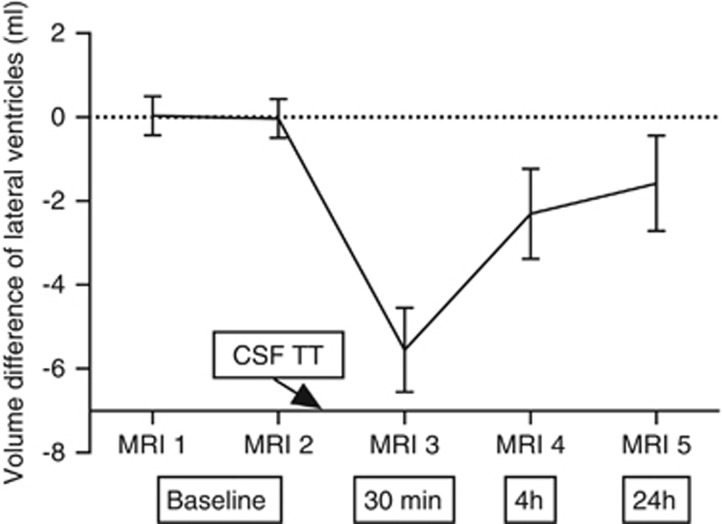
Figure 4.
The mean value of the measured volumes at MRI 1 and MRI 2 was taken as reference volume. This was subtracted from the volumes at all five investigation times to obtain the volume difference per subject. The error bars indicate the 95% CI of the volume difference, obtained from the complete group. Cerebrospinal fluid tap test (CSF TT) was performed after MRI 2. The boxes: 30 minutes, 4 hours, and 24 hours, refer to time after the CSF TT. A significant difference was found between baseline (average of MRI 1 and MRI 2) and 30 minutes (P<0.001); baseline and 4 hours (P<0.01); 30 minutes and 4 hours (P<0.001); and 30 minutes and 24 hours (P<0.01), using the Wilcoxon signed-rank test.

