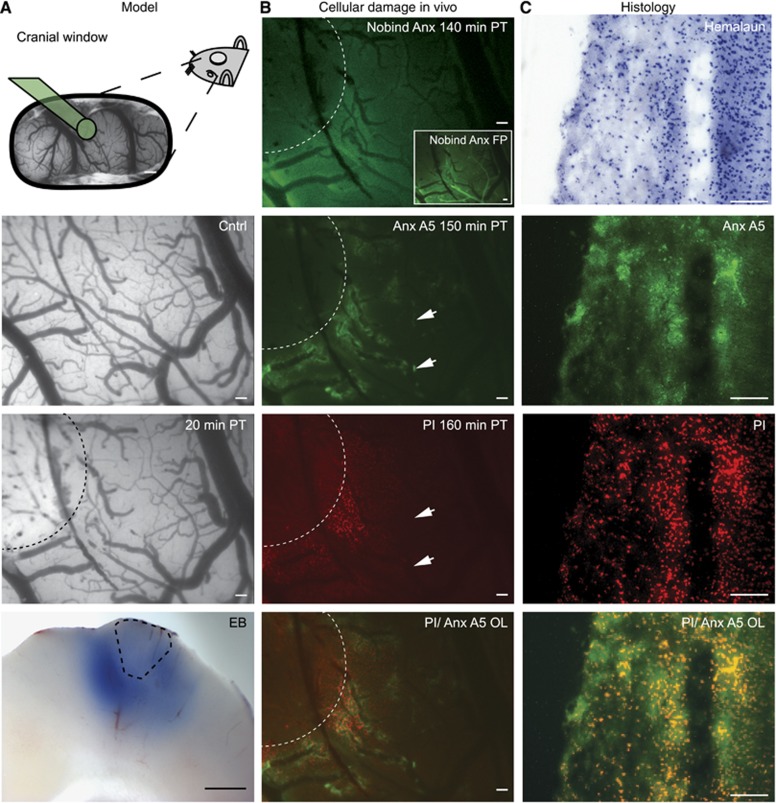
Figure 1.
Photothrombosis model description and evaluation of cell damage markers. From top to bottom: (A) representative preparation of the cranial window. Green cone projects to area undergoing photothrombosis (PT). Pial vasculature pre- and post Rose bengal-induced PT. Dotted line marks area that was illuminated by the green laser. Evans blue (EB) extravasation (bottom) indicates blood–brain barrier dysfunction on the brain's surface as well as in deep cortical layers ex vivo. Dotted line estimates lesion core. (B) Intravital microscopy revealed no specific staining with nonbinding annexin A5 (Nobind Anx A5) 140 minutes after PT. Presence of the protein, however, was confirmed during bolus first pass (FP, see inset). Binding annexin A5 (Anx A5) was found in perilesional brain parenchyma 150 minutes after PT injection, mainly in close proximity to venules. Propidium iodide (PI) stained damaged cells surrounded the lesion 160 minutes after PT. Overlay of Anx A5 and PI confirmed costaining of Anx A5-positive parenchyma with PI. Note also Anx A5-positive and PI-negative regions (arrowheads) indicating potentially reversible cell damage. (C) Hemalaun staining and Anx A5, PI and Anx A5/PI overlay as detected ex vivo. Scale bar=500 μm in A top and A bottom, all others 100 μm.

