Figure 2.
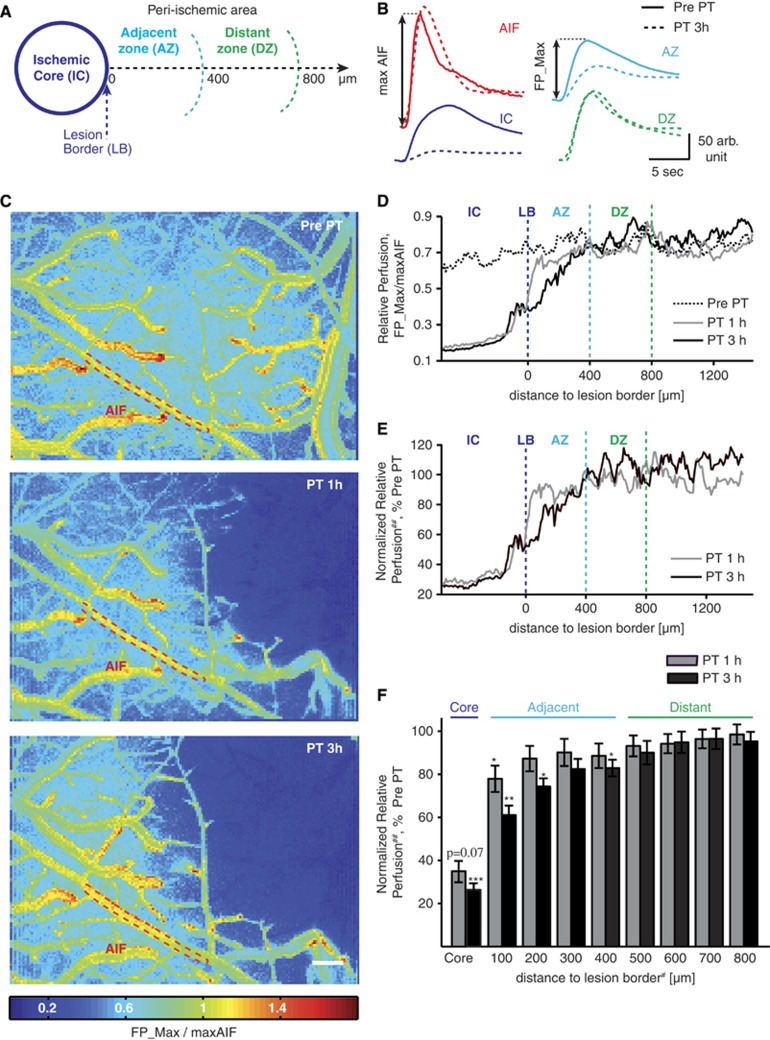
Partitioning the peri-ischemic brain according to perfusion measurements. (A) Schematic of the ischemic core (IC), the adjacent (AZ), and distant peri-ischemic zone (DZ, lesion border, LB). (B) Flow curves, taken from the fluorescent angiography illustrate reduced perfusion in AZ and IC, while the reference arteriole (AIF, arterial input function) and DZ remained unaffected. PT, photothrombosis. (C) Relative perfusion maps by pixel-based normalization of the first pass maximum (FP_Max, see B) to the maximal AIF (maxAIF). (D) Relative perfusion averaged by distance to LB. (E) Relative perfusion normalized to pre-PT perfusion calculated as follows: ##normalized relative perfusion=(FP_Max(PT)/maxAIF (PT))/(FP_Max(Pre PT)/maxAIF(Pre PT)) × 100%. (F) Quantitative analysis reveals that reduced normalized relative perfusion remains within 400 μm from LB during the 3 hours monitoring period (n=7) allowing the division of the peri-ischemic brain into AZ and DZ. For statistical analysis nonparametric paired Friedman's analysis of variance including Bonferroni post hoc correction was performed; adjusted P-values in control comparison ***P<0.001; **P<0.01; *P<0.05. Data shown as mean±s.e.m. #For graphical simplicity only largest distance shown on axis label (e.g., ‘200' contains mean of all values between 100 and 200 μm); scale bar=200 μm.

