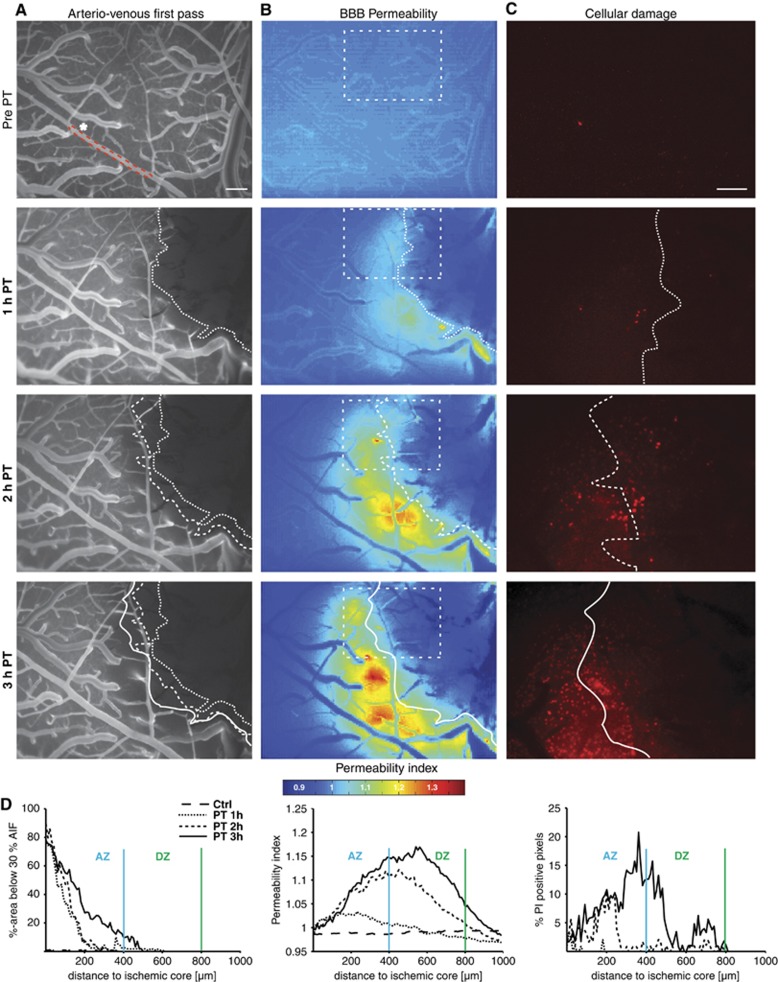
Figure 3.
Parallel intravital monitoring of relative cerebral perfusion, blood–brain barrier (BBB) permeability, and cell damage. (A–C) From top to bottom: images under control condition and 1 to 3 hours after Rose bengal-induced photothrombosis. (A) Arteriovenous first pass images. Pixels were counted as hypoperfused when below a threshold of 30% of the maximum of the arterial input function (AIF—selected arteriole marked by asterisk and red dotted line). The white dotted line marks the hypoperfused lesion core. (B) BBB permeability maps. Dotted square marks region of interest shown in C. Dotted lines were transferred from A. (C) Cell damage as detected by propidium iodide (PI). Note how cell damage progresses into normally perfused perilesional brain tissue. Increases in BBB permeability seem to precede cell damage. (D) The graphs show how hypoperfusion, increased BBB permeability, and cell damage affected growing perilesional areas with time after PT. AZ, adjacent zone; DZ, distant zone. Scale bar=200 μm.

