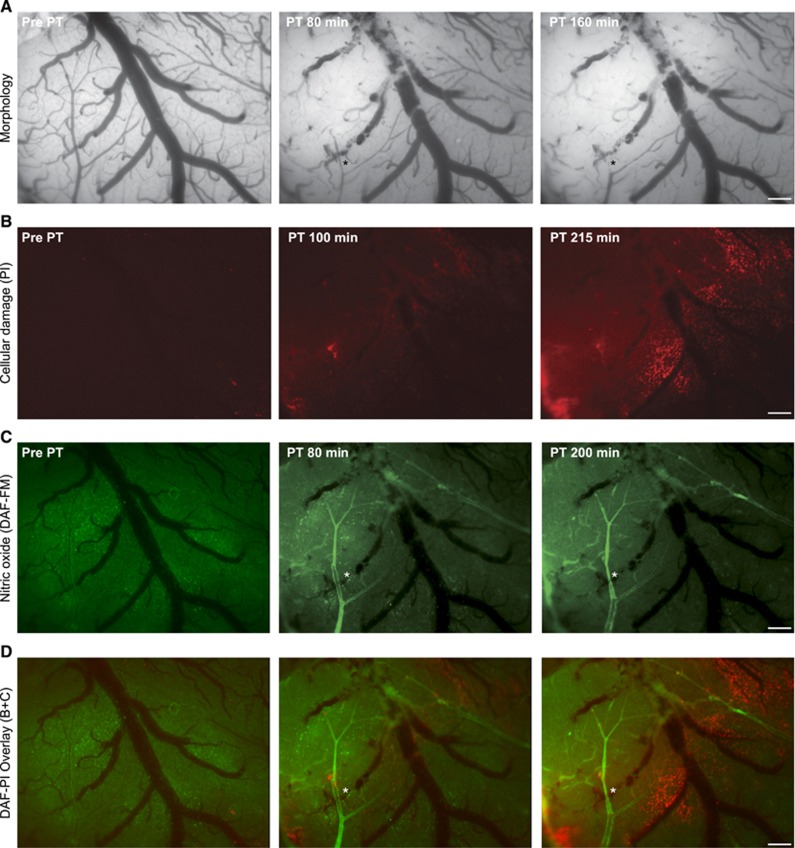
Figure 5.
Intravital microscopy reveals nitric oxide (NO) formation after photothrombosis (PT). (A) From left to right: bright field images under control condition and 80 and 160 minutes after induction of PT. Note the lesion core in the top left corner. (B) Cell damage as visualized by propidium iodide (PI). (C) Nitric oxide as detected by 4-amino-5-methylamino-2′,7′-difluorofluorescein (DAF-FM) diacetate gave a diffuse parenchymal signal before PT and clearly showed arteriolar NO production at 80 and 200 minutes after PT in the ischemic core (here veins also revealed signal) and in the peri-ischemic arterioles. (D) Overlay of PI and DAF-FM. Note how cell damage is mainly concentrated surrounding venules. (A, C, and D) asterisk indicates arteriole that was primarily perfused after PT, however, underwent delayed constriction despite NO production. Scale bar=200 μm.

