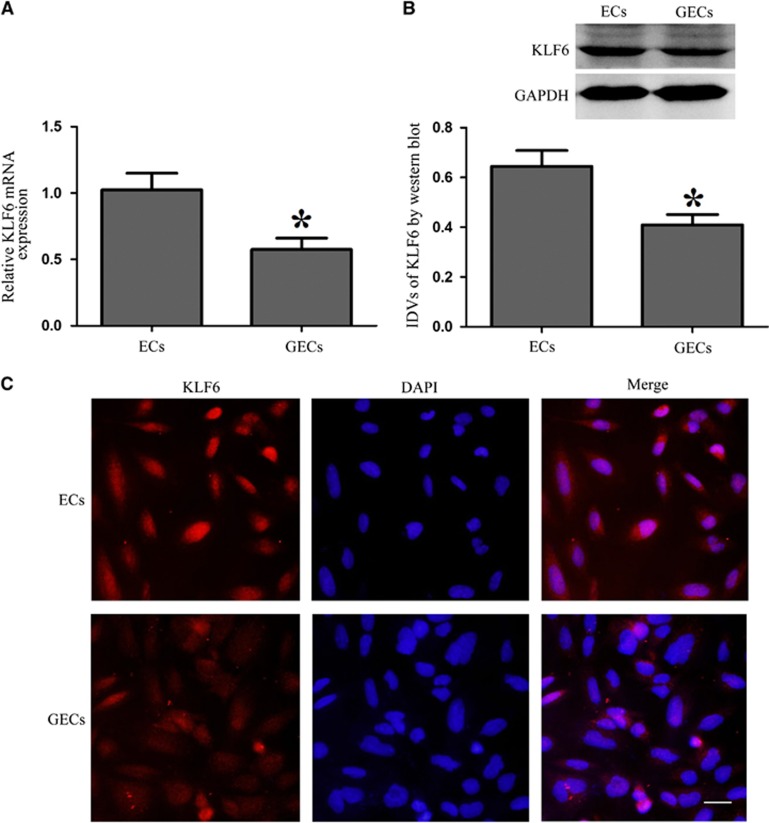
Figure 3.
Expression of Kruppel-like factor 6 (KLF6) in endothelial cells (ECs) and glioma endothelial cells (GECs). (A) Quantitative RT-PCR analysis of KLF6 in ECs and GECs. (B) Western blot analysis of KLF6 in ECs and GECs, using GAPDH as an endogenous control. Representative protein expression and their integrated light density values (IDVs) are shown. Data represent means±s.d. (n=5, each). *P<0.05 versus ECs group. (C) Immunofluorescence staining of KLF6 in ECs and GECs. KLF6 (red) was labeled with secondary antibody against KLF6 antibody and nuclei (blue) were labeled with DAPI. Images are representative of independent experiments (n=4). Scale bars represent 20 μm.

