
Figure 1.
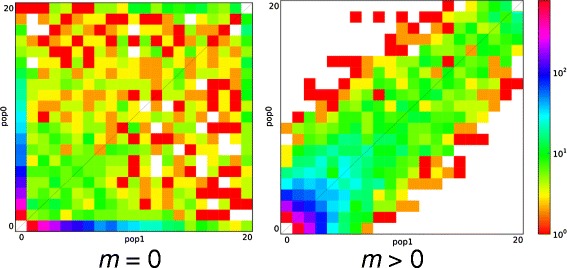
Information in the allele frequency spectrum. A comparison between two spectra of similar size (n = 10 diploid individuals sampled from each of two populations) that differ in the rate of migration between populations. Migration between populations increases the correlation in allele frequencies, thus increasing the density of SNPs falling along the diagonal of the AFS.