
Figure 6.
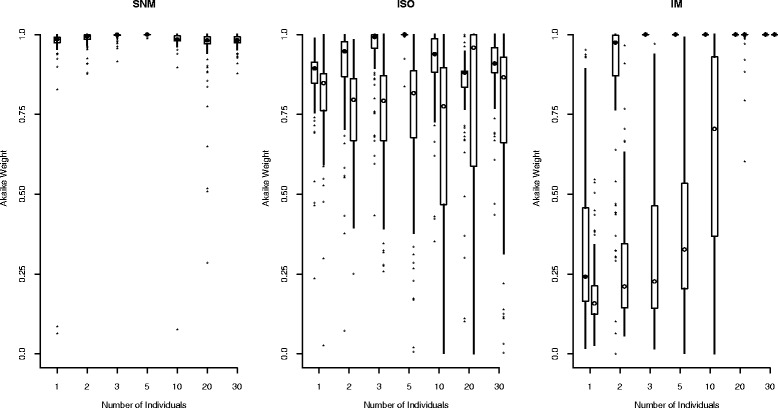
Confidence in model selection for two-population models. The distributions of Akaike weights in favor of the true model are shown as boxplots versus sample size. Both ancient (A, filled circles to the left) and recent (B, open circles to the right) parameterizations are shown. Boxplots are constructed as in Figure 4.