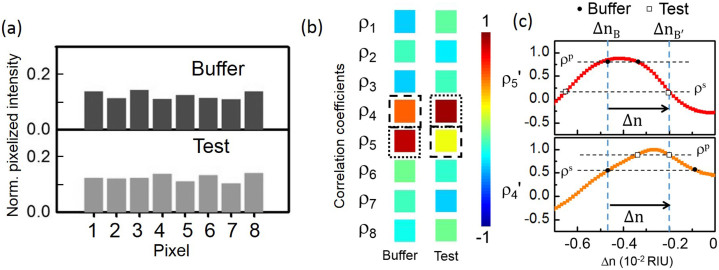
Figure 3.
(a) Modeled pixelized patterns at probe wavelength λp (1556.66 nm) upon the buffer solution and the test solution. (b) Calculated sets of correlation coefficients upon the buffer solution and the test solution. The dotted-line boxes indicate ρp and the dashed-line boxes indicate ρs. (c) A zoom-in view of the calibrated ρ5′ and ρ4′ as a function of Δn and the extracted ΔnB, ΔnB′ and Δn.

