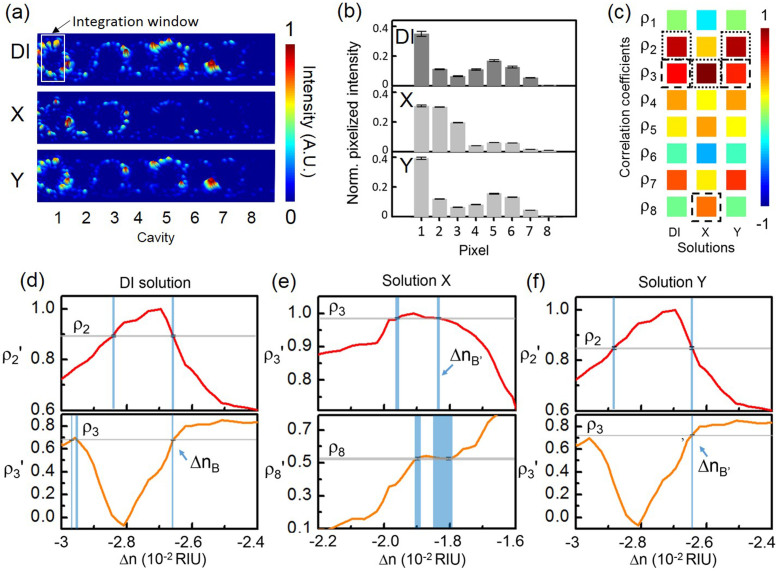
Figure 7.
(a) Measured infrared light-scattering images of the CROW at a specifically chosen probe wavelength λp2 (1565.56 nm) upon the buffer solution and the blind-test solutions X and Y. White-line box indicates the integration window for the pixelized patterns. (b) Pixelized patterns upon the buffer solution and the blind-test solutions X and Y. (c) Corresponding calculated correlation coefficients upon the buffer solution and solutions X and Y. Dotted-line boxes: ρp, dashed-line boxes: ρs. (d)–(f) Mapping of ρp and ρs with the library to extract Δn. (d) Upon the buffer solution. (e) Upon solution X. (f) Upon solution Y.

