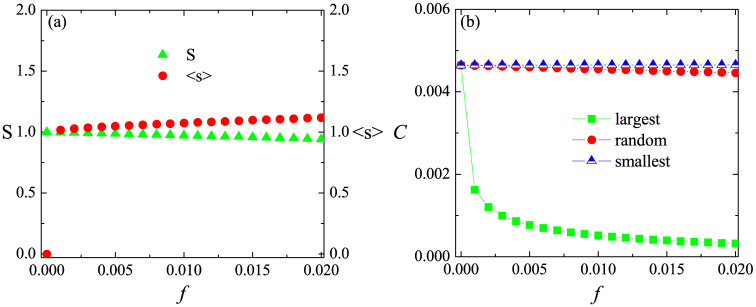
Figure 3.

(a) Size of the giant connected component S (normalized to the network size), mean size of isolated clusters 〈s〉, and (b) clustering coefficient C, as functions of the fraction of removed nodes f. Here, it is worth mentioning that we focus on the case of pruning the largest-degree nodes in (a), yet provide a brief comparison of three strategies in (b). Same stipulations as in the Caption of Fig. 1.
