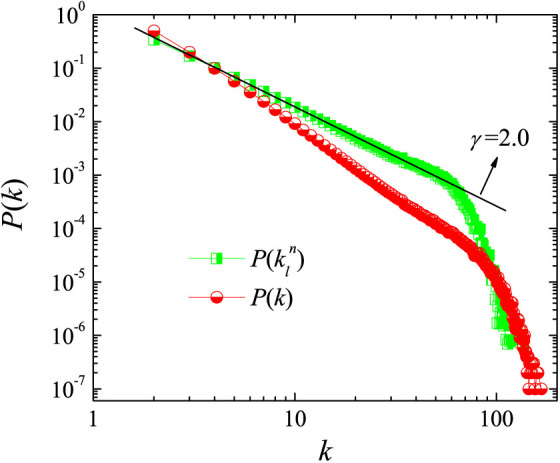
Figure 5.  (see text for definition) and the degree distribution P(k) vs. the degree k.

The straight line is drawn accordingly to the analytical predictions of Eq. (8). All results are obtained on BA networks with N = 103, 〈k〉 = 4.
