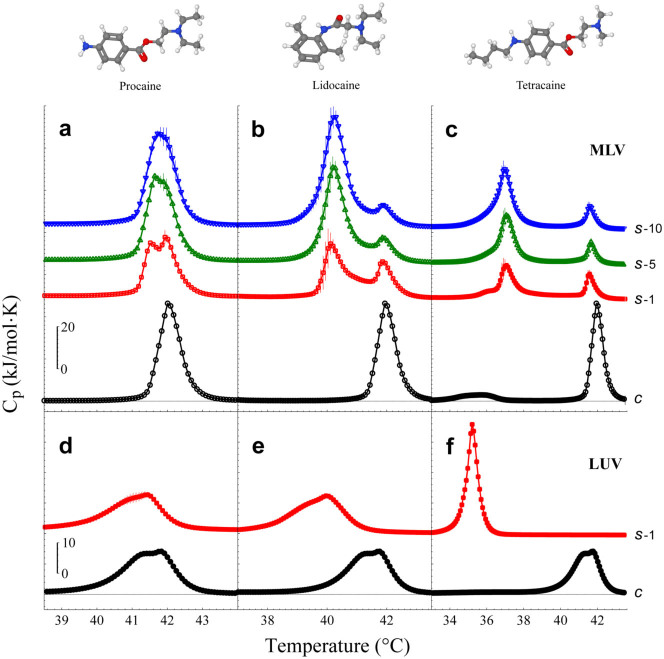
Figure 1. Calorimetric profiles of MLV and LUV systems under the influence of local anesthetics.
Local anesthetics were added to the MLV and LUV suspension at their respective clinical concentration. After 10 min, a complete sequence of successive heating scans was performed. (a) Procaine (73 mM), (b) Lidocaine (69 mM) and (c) Tetracaine (25 mM). Control experiments (c, black circles) showed the main transition temperature at 42.0°C ± 0.01°C. Scans 1 (s-1, red squares), 5 (s-5, green up-triangles) and 10 (s-10, blue down-triangles) are taken from the scan series. The time between scans is about 36 min. The same process is shown for (d) Procaine, (e) Lidocaine and (f) Tetracaine in a LUV suspension. Since all the subsequent LUV scans do not show differences, only scan 1 (s-1, red squares) is presented. Intrinsic differences between MLV and LUV are commonly observed in the control calorimetric profiles, however, ‘clinical conditions’ were responsible for this peculiar deformation in the main transition of LUV. The solution was adjusted to pH ~5 (HCl/NaOH). Error bars show standard deviation.

