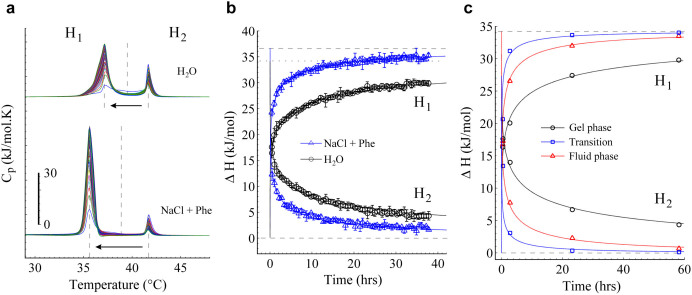
Figure 3. Diffusion kinetics and membrane-phase dependence diffusion of TCC.
(a) A sequence of 65 calorimetric profiles of the TCC diffusion kinetics in both ‘free’ (upper curves) and ‘clinical conditions’ (lower curves). The ‘double-phase transition’ is splitted in two sections (H1 and H2) from the midpoint between the two transitions. The time between scans was about 36 min. (b) Enthalpies of H1 and H2 as function of time for both ‘free’ (black circles) and ‘clinical conditions’ (blue triangles). Best-fit models are indicated respectively, from where the diffusion coefficient, κ, for ‘clinical’ (2.35) and ‘free conditions’ (0.45) was obtained. Total calorimetric enthalpy values (ΔHmax) were ~36.7 and ~34.2 kJ/mol for ‘clinical’ (dashed line) and ‘free conditions’ (dotted line), respectively. Error bars show the standard deviation. (c) Enthalpies of H1 and H2 as function of time for experiments performed in gel phase (25°C; black circles), fluid phase (41.8°C; red triangles) and phase-transition temperature (55°C; blue squares), at ‘free conditions’. The κ values for phase transition temperature (9.5), fluid phase (1.7) and gel phase (0.28) were obtained from the diffusion model fit. Only four representative stages from the complete kinetics were carried out to describe the membrane-phase dependence in the three respective conditions. TCC was added to MLV and twelve independent experiments were incubated the required time at their respective temperature. TCC was always used at 25 mM and the solution was adjusted to approximately pH 5 (HCl/NaOH).

