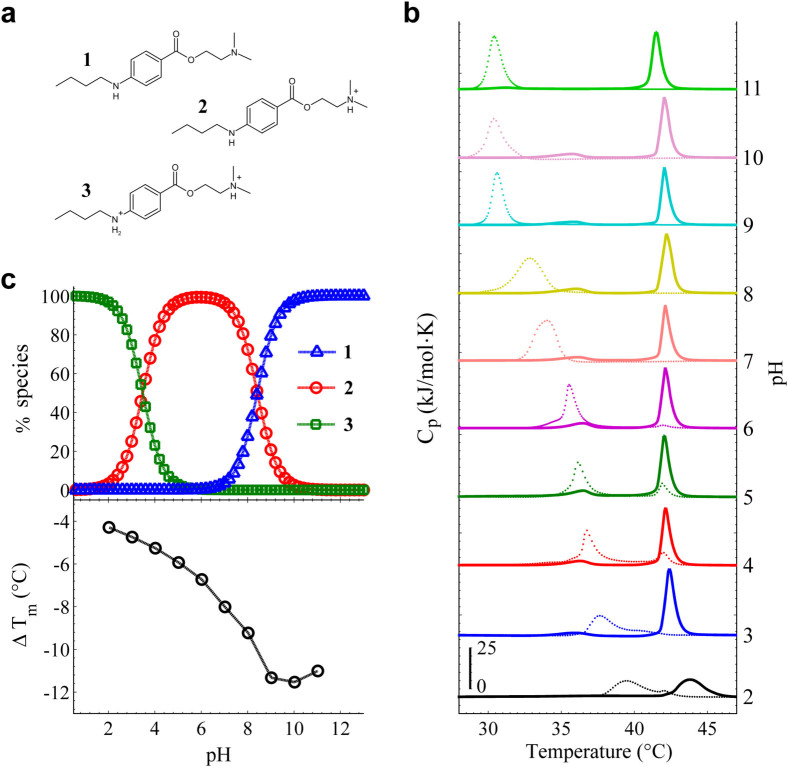
Figure 4. The pH dependence of the ΔTm.
(a) Three TCC species: non-protonated (1), once-protonated (2) doubly-protonated (3). (b) Calorimetric profiles of both control (solid line) and TCC (dotted line) experiments as function of pH. MLV samples were prepared in different buffers depending on their pH range of buffering. The experiments were carried out in ‘free conditions’. Note that a ‘double-phase transition’ behaviour due to TCC occurs in the pH range of clinical application (pH 4–6). (c) Top panel shows the percentage of the species distribution of TCC as function of pH. When pH is above pKa2, specie 1 is more favored. Between pKa1 and pKa2, specie 2 is most prevailing, whilst 3 is major below pKa1. Lower panel shows the ΔTm between the control and TCC profiles presented in b as function of pH.

