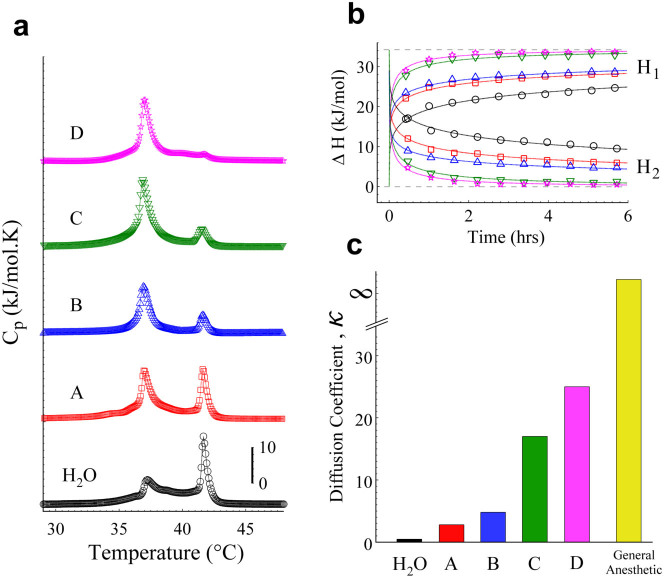
Figure 5. The diffusion kinetics of TCC modulated by CA.
MLV liposomes were prepared in different CA solutions adjusted to pH 5 (HCl/NaOH). After 10 min of the TCC (25 mM) addition, a sequence of 10 heating scans was taken by the DSC. (a) The first scans of H2O (black circles), malic acid (A, red squares), citric acid (B, blue up triangles), formic acid (C, green down triangles) and glycolic acid (D, magenta stars) were sorted according to their stage in the diffusion kinetics. (b) Enthalpies of H1 and H2 as function of time for both H2O and the respective CA. Upper grey dashed line stands for the ΔHmax (~34.2 kJ/mol), which remains constant throughout the CA experiments. (c) The respective κ values were obtained from the best-fit of the diffusion model as illustrated in b. Note that the ‘single-phase transition’ obtained by general anesthetics may obey the diffusion model under a very high κ value.

