
Figure 2.
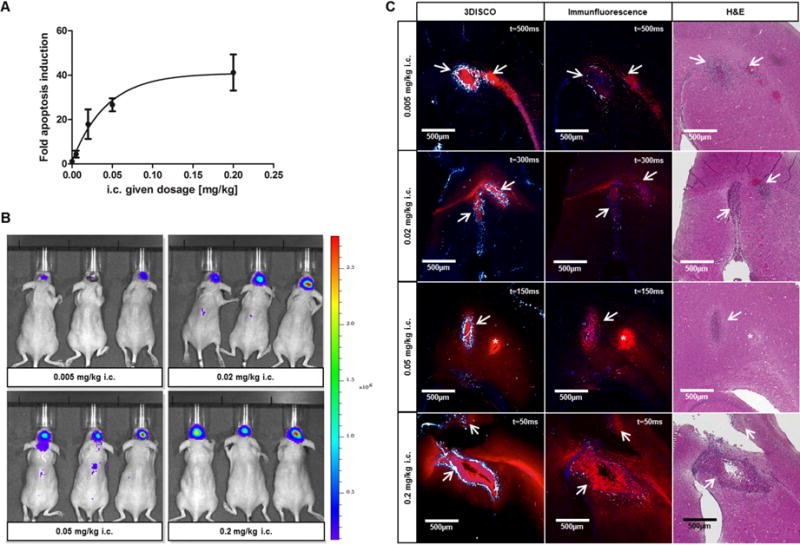
Dosage response curve and evaluation of drug delivery after i.c. application. (A) Dosage response curve showing fold induction of apoptosis reporter activity after i.c. application of 0.005, 0.02, 0.05, and 0.2 mg/kg anti-DR5-Cy5. Curve was fitted by nonlinear regression. (B) Representative BLI images 4 hours after i.c. application of anti-DR5-Cy5 at different dosages. (C) Representative 3DISCO (left) and related immunofluorescence (middle) and H&E (right) images showing anti-DR5-Cy5 distribution (red) in the brain after i.c. application. Strong lectin vessel staining (white-blue) in 3DISCO images allows localization of brain tumor site (arrows); t = exposure time; * Injection channel, middle panel: Cell nuclei (blue).