
Figure 5.
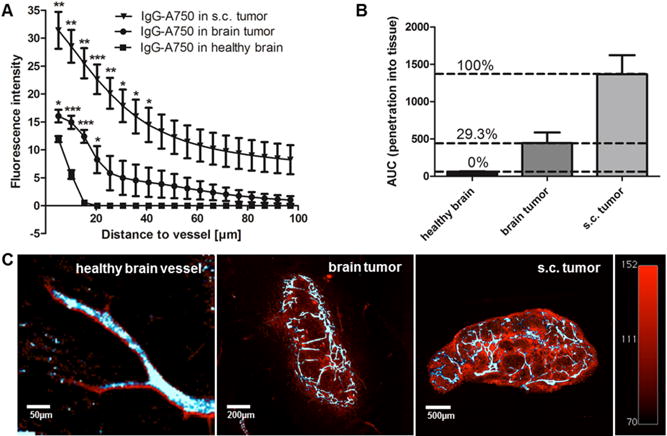
Different penetration of i.v. applied, unspecific IgG-A750 out of healthy, s.c. or brain tumor vessels. (A) Graphs displaying mean IgG-A750 fluorescent signals as a function of distance from the nearest healthy brain or tumor vessel; *p < 0.05, **p < 0.02, ***p < 0.01; n = 4. (B) AUCs of penetration graphs displayed in (A) and the related percentage of BBB disruption. (C) Representative 3DISCO overlay images of lectin-A647 staining (white-blue) and IgG-A750 distribution (red) to depict IgG-A750 penetration into surrounding tissue. Color scales and exposure times of different samples were standardized to compare images.