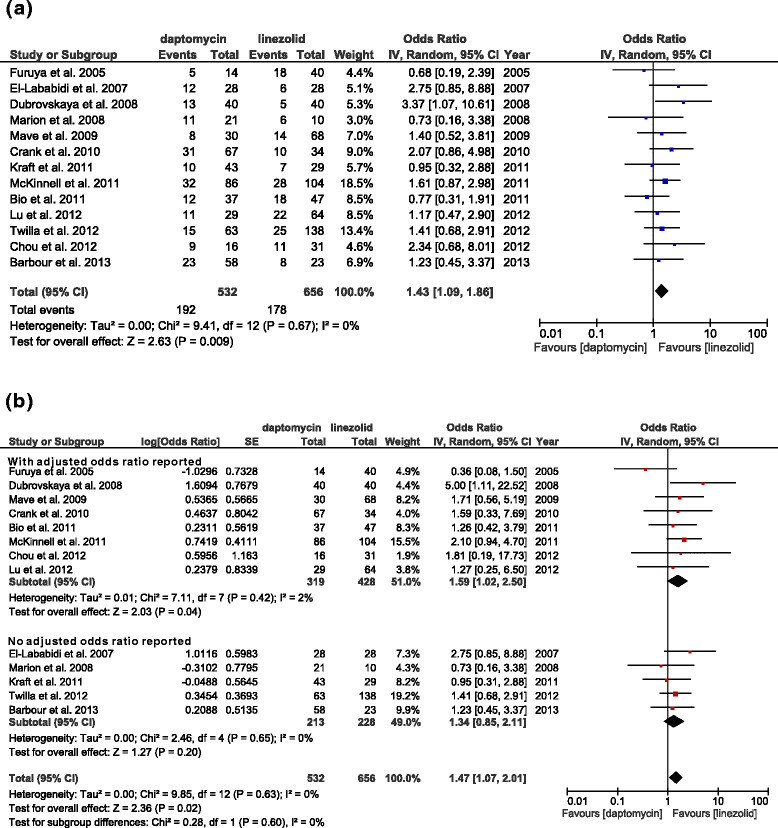
Figure 2.

Forest plots of raw mortality and mortality in which aORs were and were not reported. (a) ORs of all 13 studies. (b) ORs of studies that did (n = 8) and did not (n = 5) report aORs. Here and below, the vertical line indicates the “no difference” point of the 2 regimens and the horizontal lines indicate 95% confidence intervals (CIs). ∎, odds ratio; ♦, pooled odds ratio for all studies.
