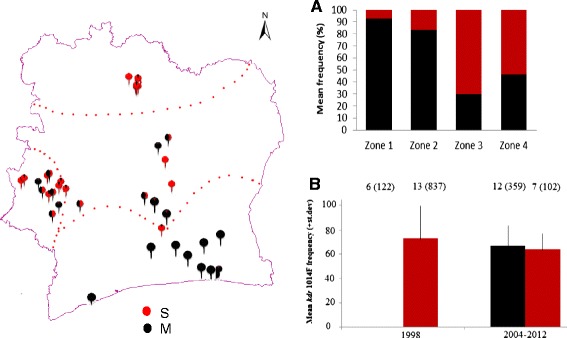
Figure 2.

Distribution of An. gambiae M (black) and S (red) molecular forms across the four ecological zones of Côte d’Ivoire; each recording is shown by a separate point and mean frequency prevalence described in Plot (A). Mean kdr 1014F frequency across sample sites in each form in early samples (from 1998) and more recent samples (2004–2012); and sample sites (and total numbers genotyped) are shown at the top of the plot (B).
