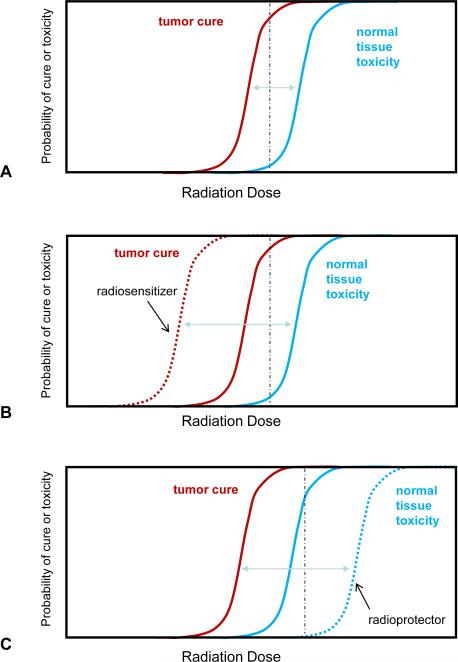
Figure 1. Therapeutic ratio and radiation modifiers.
A) The probability of tumor cure (red) and normal tissue toxicity (blue) can be plotted as a factor of radiation dose. Note that these are parallel idealized sigmoidal curves which may not be representative of the clinical condition. A therapeutic dose may be selected that delivers a high chance of tumor cure with an acceptable rate of toxicity (black dashed line). B) A tumor selective radiation sensitizer increases the probability of tumor cure for a given dose (red dashed line), hence the tumor control curve is shifted to the left. This results in a higher chance of cure for the same radiation dose as delivered in A) (black dashed line). Alternatively, a lower dose may be delivered to yield the same rate of cure with less normal tissue toxicity. C) A normal tissue radioprotector decreases the probability of normal tissue toxicity for a given dose of radiation, thus pushing the toxicity curve to the right (blue dashed line). This allows a higher dose to be given to obtain a higher rate of cure with less or equivalent normal tissue injury.

