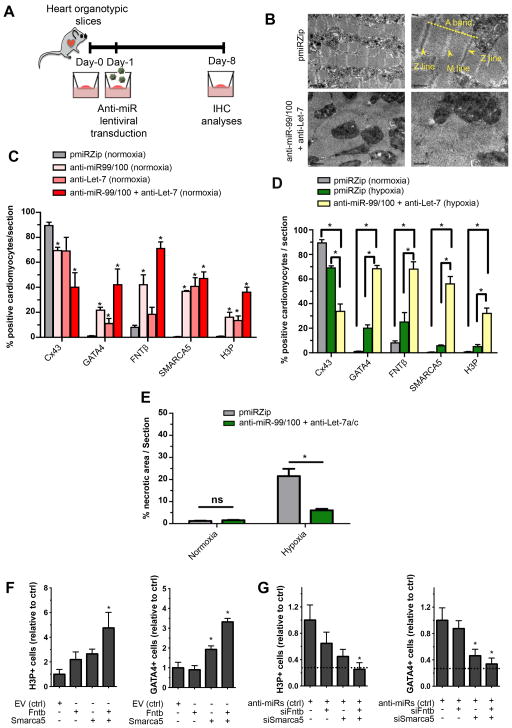
Figure 6. Myocardial tissue can be induced to a partially dedifferentiated proliferative state by anti-miR treatment.
(A) Diagram describing organotypic culture experiments: ventricles were obtained from wild-type mice, cut into slices and put in culture conditions. At 24 h, they were transduced with the antimiR constructs and evaluated by immunohistochemistry (IHC) analyses for cardiomyocte proliferation/dedifferentiation, after 7 days. (B) Representative pictures showing that sarcomeric disorganization was readily observed by electron microscopy after induced dedifferentiation in adult cardiac tissue. (C) Quantitative analyses of normoxic organotypic cultures demonstrating significant increases in FNTβ and SMARCA5, enhanced numbers of dedifferentiated cardiomyocytes -determined by Cx43 and GATA4 expression- and significantly increased numbers of proliferating cells, upon anti-miR treatment. (D) Quantitative evaluations of hypoxic organotypic cultures demonstrating cardiomyocyte dedifferentiation upon anti-miR treatment as indicated by GATA4 re-expression, reduced number of Cx43+ cells and increased Histone 3 phosphorylation (H3P). (E) Histomorphometric evaluation of the damaged myocardium in normoxic and hypoxic conditions after Masson’s trichrome staining. (F) Lentiviral overexpression of Fntb, Smarca5 or both is sufficient to impose a dedifferentiated profile in neonatal murine cardiomyocytes. (G) In primary neonatal murine cardiomyocytes, knock-down of miR 99/100 and Let-7a/c is insufficient to promote a dedifferentiated state in the absence of Fntb/Smarca5 (knocked-down with siRNAs), suggesting these two proteins are mostly responsible for the effects of the miRs. In G, dashed lines represent the baseline values in the untreated condition (absolute values being 8% H3P+ and 2.5% GATA4+ cells). Data are represented as mean +/− s.e.m. *p<0.05. n = 4 independent experiments/condition, 3 sections/experiment/condition were used for quantitative analyses. See also Figure S6.

