. 2014 Dec 16;3:e04147. doi: 10.7554/eLife.04147

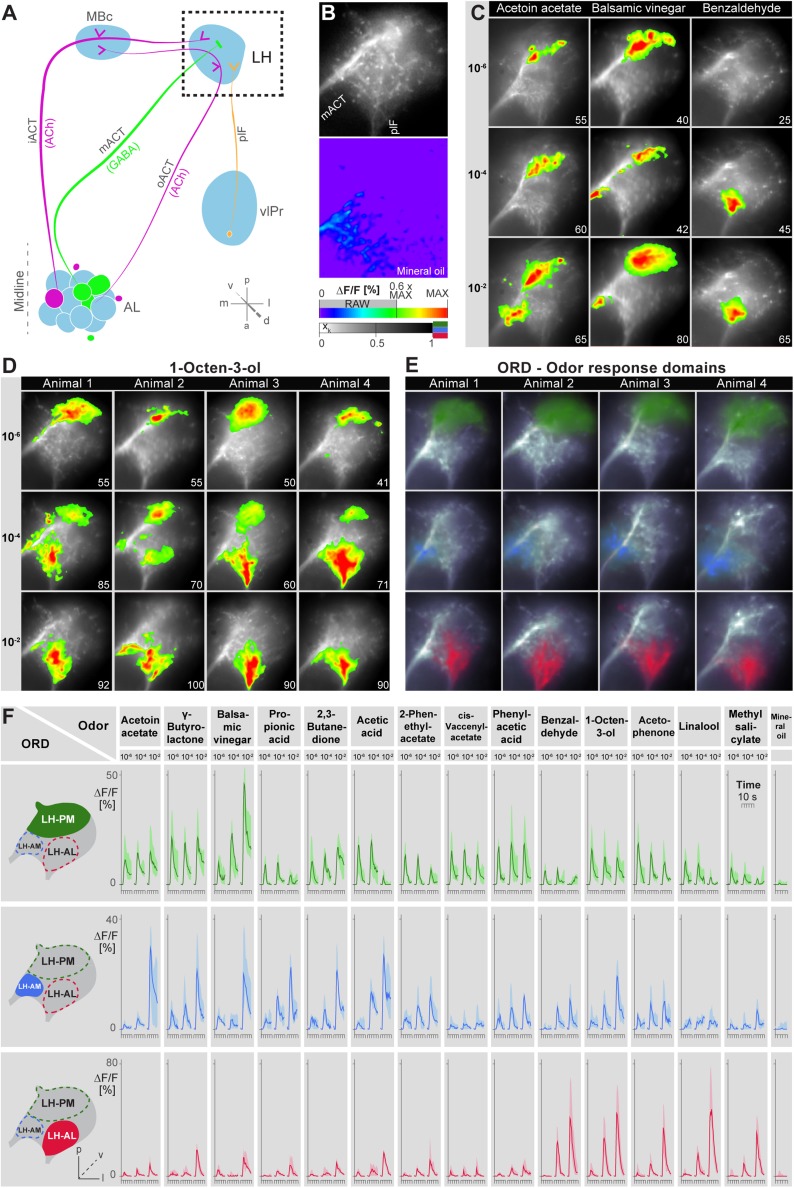
Figure 2. Odors evoke specific and stereotypic calcium responses in the LH subdivided into three distinct odor response domains.

(A) Schematic of the olfactory circuit with the investigated area highlighted. (B) RAW image of the LH (top picture) depicting the recorded area of figures (CE) and the false color image (bottom picture) during the solvent application. The ΔF/F scale bar applies for all false color-coded pictures; the alpha-bar for the pixel participation xk of the indicated colors applies for (EF). (C) Representative LH Ca2+ responses (ΔF/F%) of acetoin acetate, balsamic vinegar and benzaldehyde at three concentrations. Numbers in the lower right corner indicate individual maxima. (D) Odor-evoked Ca2+ responses (ΔF/F%) are exemplarily depicted for 1-octen-3ol- at three concentrations in four animals. (E) NNMF-extracted LH odor response domains (ORD) of four representative animals: three LH ORDs were fully reproducible after being extracted from all measured animals. Domains classified as identical are similarly color-coded: the green ORD is located in the posterior-medial region of the LH (LH-PM); blue, in the anterior-medial (LH-AM), and red in the anterior-lateral LH area (LH-AL). The alpha-bar for green, blue and red shades is placed in (B). (F) Left, schematic outlines of the LH with indicated ORDs. Right, median activity traces of all odors at three concentrations are depicted for each colored ORD. Shadows represent lower and upper quartiles (n = 6–7).

DOI: http://dx.doi.org/10.7554/eLife.04147.006

Figure 2.

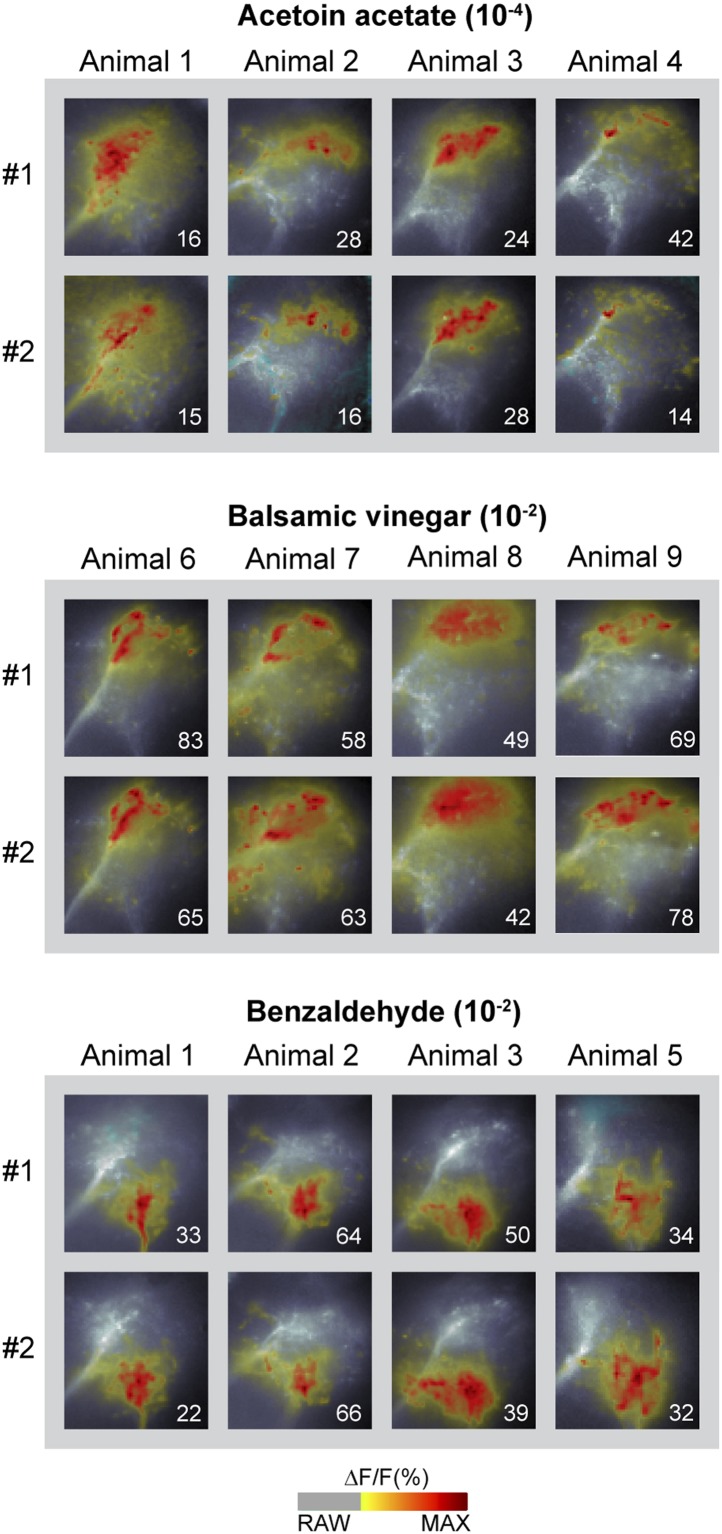
Figure 2—figure supplement 1. Odor-evoked activity patterns in the LH are reproducible and stereotypic.

Figure 2—figure supplement 1.

Odor-evoked Ca2+ responses (ΔF/F%) in the LH for the three odors acetoin acetate, balsamic vinegar and benzaldehyde in four animals are shown as false-color coded images. Two measurements in each animal are given to reveal that the activity patterns are highly reproducible within one animal. Comparison between the patterns among individuals shows that the activity regions are stereotypic. Numbers in the lower right corner indicate individual maxima. The ΔF/F scale bar is shown at the bottom.
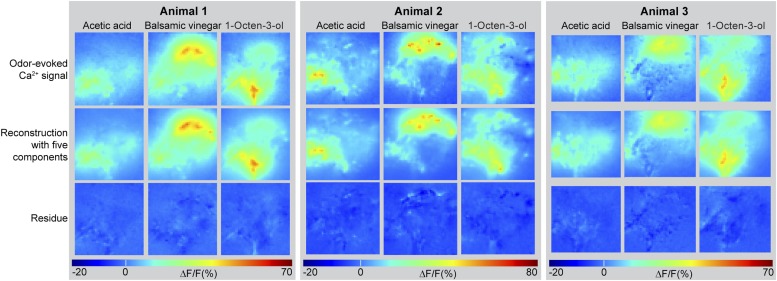
Figure 2—figure supplement 2. Odor-evoked activity patterns in the LH can be reconstructed with five components.

Figure 2—figure supplement 2.

Above, Odor-evoked Ca2+ responses (ΔF/F%) in the LH for the three odors acetic acid, balsamic vinegar and 1-octen-3-ol in three animals are shown as false-color coded images. The ΔF/F scale bar is shown at the bottom. Middle, activity patterns were reconstructed using NNMF with five components. Below, residue of the pattern reconstructions with five components (as shown in the middle panel) revealing that no stimulus related activity remained.
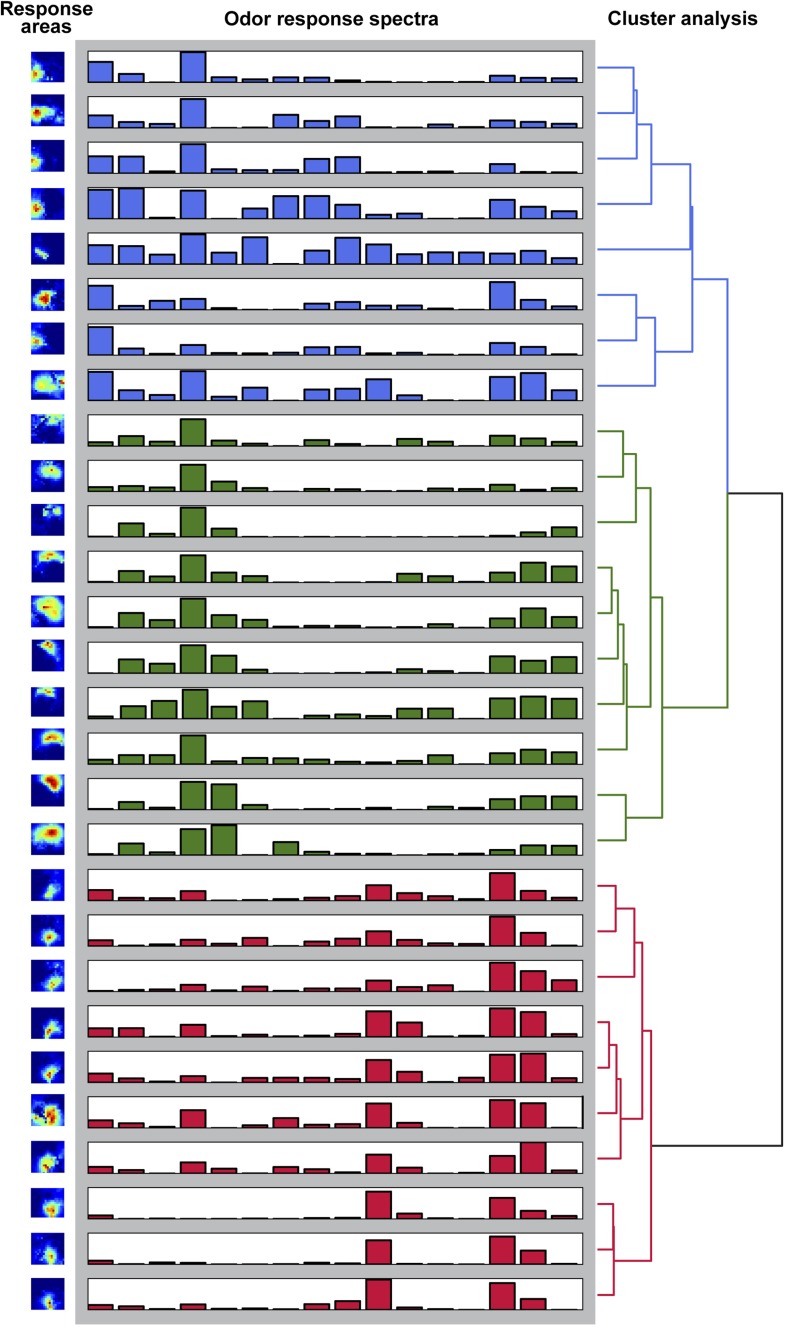
Figure 2—figure supplement 3. Odor-evoked activity patterns in the LH cluster into three components.

Figure 2—figure supplement 3.

Hierachichal clustering (UMPGA) of the odor response spectra of the NNMF components with a reliable stimulus response (trial-to-trial correlation >0.7, that is, 28 out of 35 components in seven animals). The response spectra segregate into three distinct clusters according to their stimulus response spectra. The corresponding response areas (left pictures) are located in similar regions of the LH.