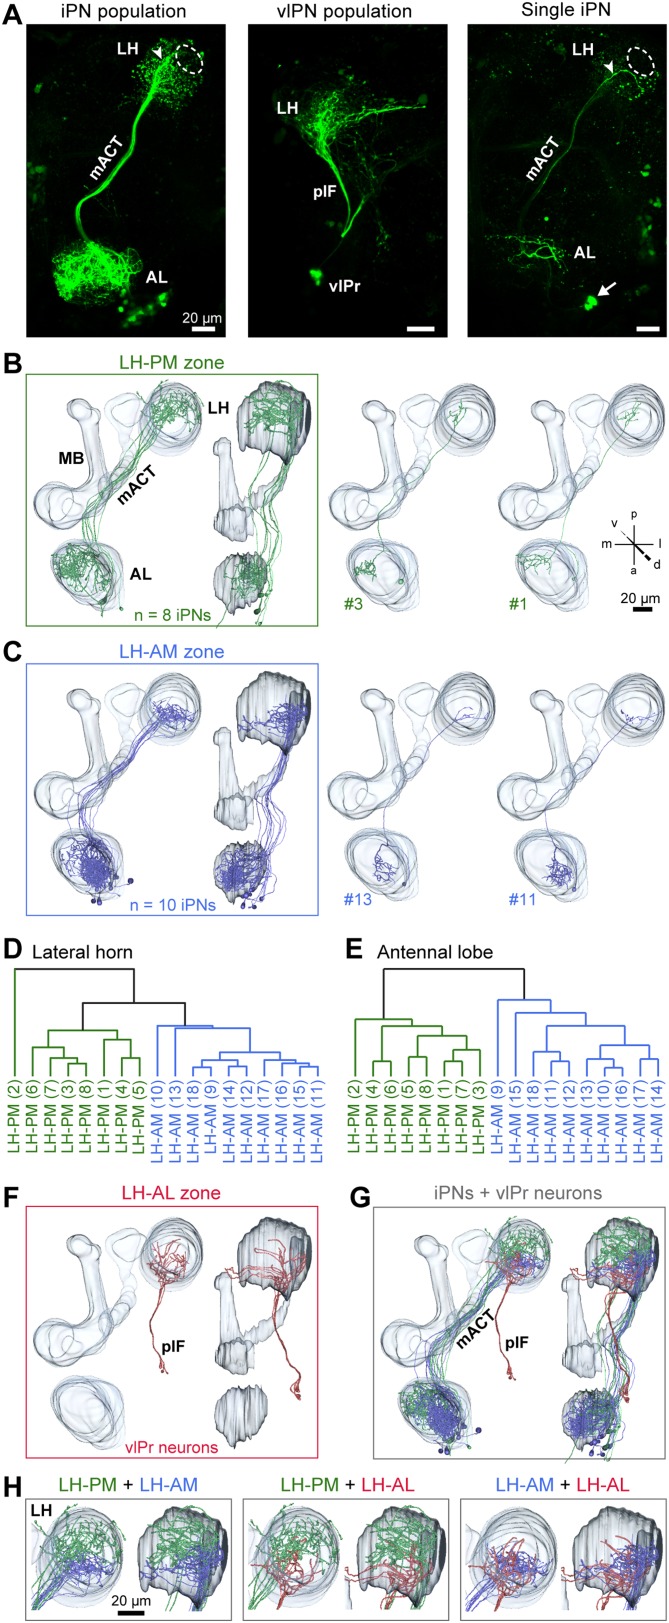
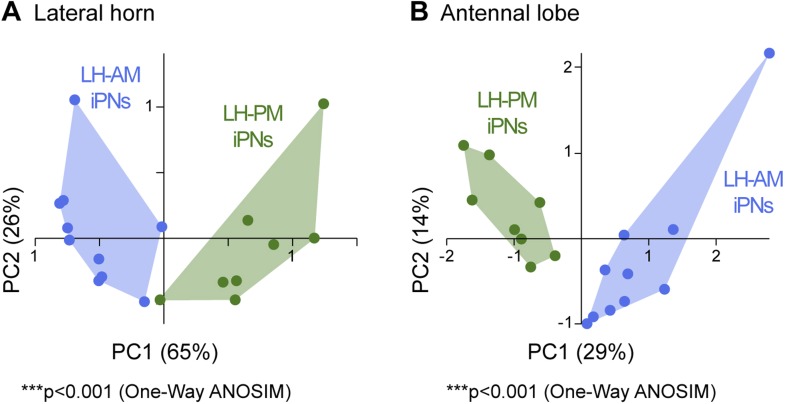
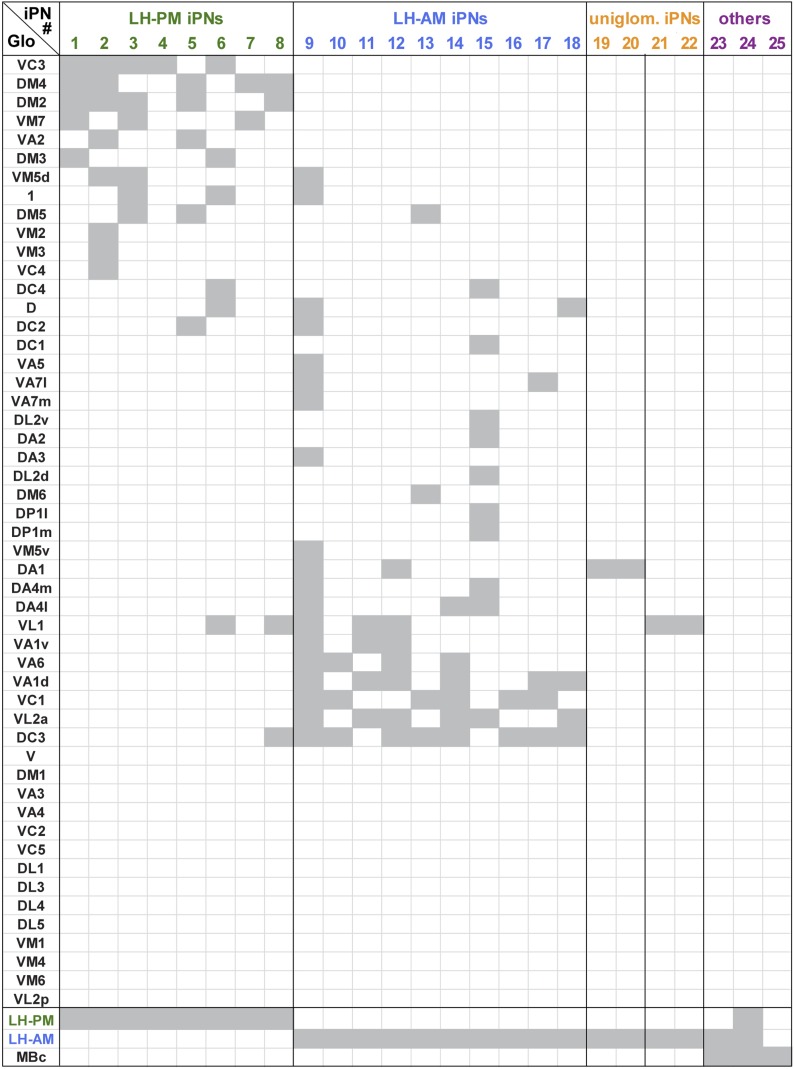
Figure 3. iPNs can be classified according to their projection pattern in three distinct LH zones.
(A) Complete population of MZ699+ iPNs labeled using PA-GFP (left image), the posterior-lateral LH region is encircled, arrowhead indicates the final common projection point of iPN axons. Middle image: photoactivation of all vlPr neurons of the MZ699-GAL4 line that project from the LH to the vlPr via the plF. Right image: exemplary single iPN, labeled by photoconverting PA-GFP in a single soma (arrow). Scale bar, 20 µm. (B) Framed images: neuronal reconstructions of all iPNs projecting to the LH-PM zone (n = 8) with outlined olfactory neuropils. View from dorsal (left) and lateral (right). Right part represents two exemplary registered individual iPNs. (C) Neuronal reconstructions of all iPNs projecting into the LH-AM zone (n = 10), images are arranged as in (B). (D and E) Cluster analyses based on the target areas of all terminals of each iPN in the LH (D) or based on the innervated glomeruli in the AL (E). The dendrograms are split into colored subclusters. Below each dendrogram, each individual iPN is specified according to the labels in Figure 3—figure supplement 2. Note, that iPNs can be morphologically clustered according to their target or input regions. (F) Neuronal reconstruction of vlPr neurons projecting through the plF to the LH-AL zone. (G) Combination of all registered neurons. (H) Dual combinations of all registered neurons with their projections in the LH.


