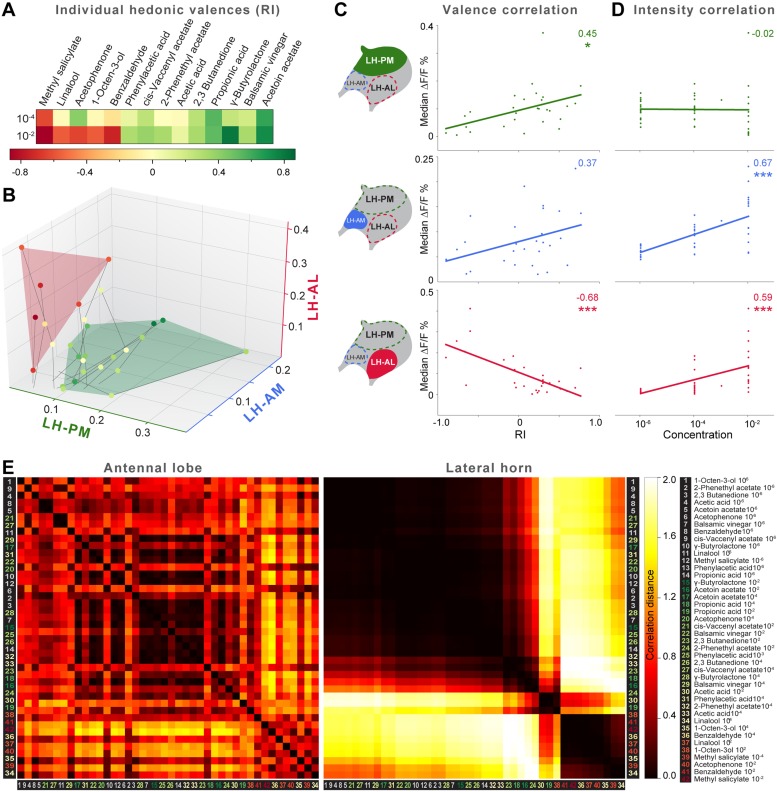
Figure 6. Integration of hedonic valence and odor concentration into ORDs.
(A) Response indices of wild type flies for all odors at median and high concentrations. Odors are sorted from highly aversive (−1, red) to highly attractive (+1, green). (B) 3D-scatter plot of median Ca2+ responses of all odors based on the three ORDs. Odor-dots are labeled due to their RI shown in (A). Same odors at different concentrations are connected with a line: the dot at the end depicts 10−2, the centered dot 10−4, and the end of the line 10−6. Attractive and aversive odor representations form separate clusters. (C and D) Left, schematic LH outlines with colored ORDs corresponding to data on the right. Correlation score r (upper right corner) between median activity and measured RI in T-maze experiments or odor concentration, respectively, with significance denoted below. Student's t test, *p < 0.05, ***p < 0.001. (E) Complete correlation matrices for Ca2+ response patterns of OSNs in the AL (left) and iPNs in the LH (right). The odors are arranged according to single linkage clustering of the LH activity patterns. Heatmap color-code refers to the correlation distance scale bar on the right. Correlation distance is defined as 1 − r, where r is the Pearson correlation coefficient between the response patterns of two odorants. Odor letters are color-coded according to hedonic valence; 10−6 RI values are labeled in grey (complete list right hand).


