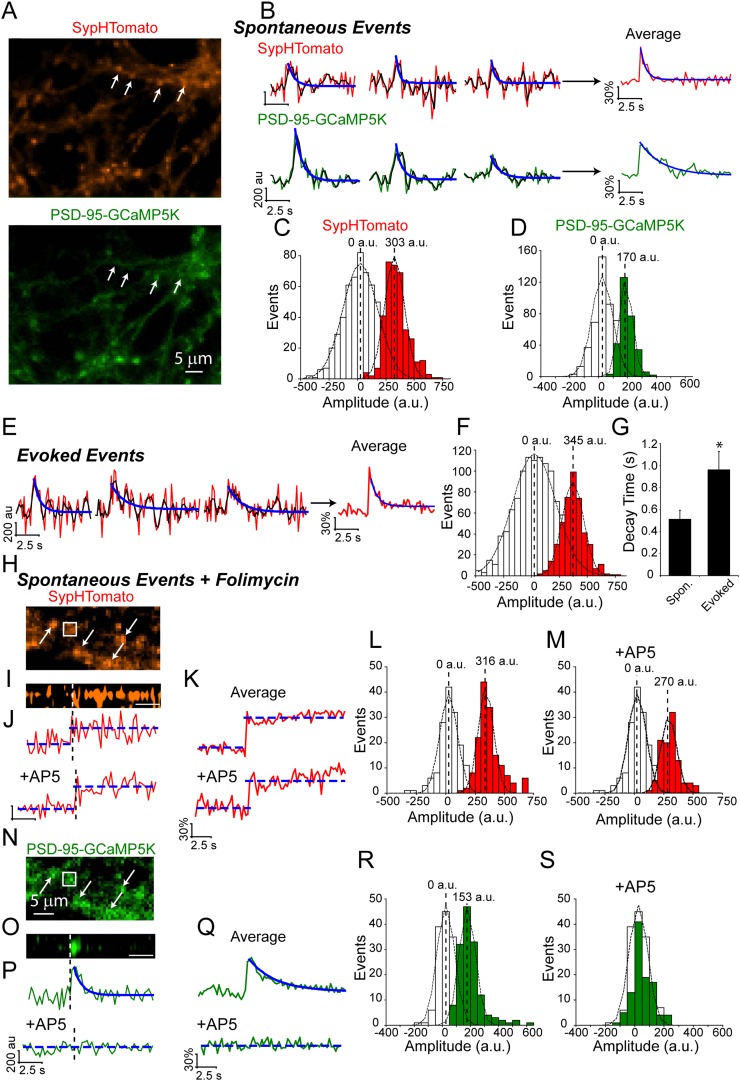
Figure 2. Dual color imaging shows that spontaneous fusion events are coupled to postsynaptic NMDA receptor-driven Ca2+ signals.
(A) Example images of SypHTomato and PSD-95-GCaMP5K expression. Arrows indicate putative synapses. Scale bar is 5 μm. (B) Example traces of SypHTomato (raw data in red, a moving average of three points in black and a fit of the decay time t in blue) and PSD-95-GCaMP5K (raw data in green, a moving average of three points in black and a fit of the decay time in blue). Because spontaneous increases in fluorescence were very small, we averaged events for each experiment representative average traces are shown at right. (C) The amplitude distribution of SypHTomato could be well fit with a Gaussian curve centered at 303 ± 92 a.u. (χ2 = 0.86) (n = 361 events from four coverslips generated from two cultures). (D) Amplitudes of PSD-95-GCaMP were distinguishable from noise and could be fit with a Gaussian curve with mean amplitude of 170 ± 50 (χ2 = 0.98) (n = 361 events from four coverslips generated from two cultures). (E) Example traces of SypHTomato fluorescence in response to single action potentials delivered at 0.05 Hz. Again, raw data is in red, a moving average of 3 points is in black and the decay time fit is in blue (n = 443 events from four coverslips generated from two cultures). (F) Amplitudes of fluorescence increases evoked by action-potential stimulation could be well fit by a Gaussian curve with mean of 345 ± 95 a.u (χ2 = 0.99). (G) Averaged traces of spontaneous increases in fluorescence decayed back to baseline with decay time = 0.51 ± 0.08 s (n = 4), while events that responded to stimulation (n = 3) decayed much slower t = 0.96 ± 0.06 (Student's t-test p value <0.05). (H) Example image of SypHTomato expression in the presence of folimycin. Arrows indicate putative synapses. The box is the region from which a line scan was taken (shown in panel I). (I) Line scan of SypHTomato fluorescence. White dashed line indicates where on the corresponding trace the fluorescence step occurred, scale bar = 2.6 s. (J) Example traces of events in the presence and absence of AP-5 from the same synapses. (K) Average of traces from the experiment of step-wise increase in fluorescence in the presence and absence of AP-5. (L) Increases in fluorescence in the presence of folimycin were separable from noise and could be fit with a Gaussian with mean amplitude of 316 ± 65 a.u. (χ2 = 0.49) (n = 154 events from four coverslips generated from two cultures). (M) The same synapses in the presence of AP-5 showed spontaneous increases in fluorescence that were still distinguishable from noise albeit with a slightly smaller amplitude distribution 270 ± 65 a.u. (χ2 = 0.48) that was not significantly different from amplitudes in the presence of folimcyin (not shown; KStest p < 0.01) (n = 103 events from four coverslips generated from two cultures). (N) Example image of corresponding PSD-95-GCaMP5K fluorescence. White arrows indicate putative synapses. The box is the region from which a line scan was taken. (O) Line scan of PSD-95-GCaMP5K fluorescence signal that occurred at the same time as the above SypHTomato signal. (P) Example traces of events in the presence and absence of AP-5. (Q) Average of traces in the presence and absence of AP-5. In the presence of AP-5, entry of Ca2+ into the postsynaptic terminal is prevented and thus there is no GCaMP5K signal. (R) PSD-95-GCaMP5K signals were separable from noise and could be fit with a Gaussian curve with mean amplitude of 153 ± 58 a.u. (χ2 = 0.80) (n = 154 events from four coverslips generated from two cultures). (S) In the presence of AP-5, Ca2+ is prevented from entering the postsynaptic terminal and results in no detectable GCaMP5K events (n = 103 events from four coverslips generated from two cultures.).

