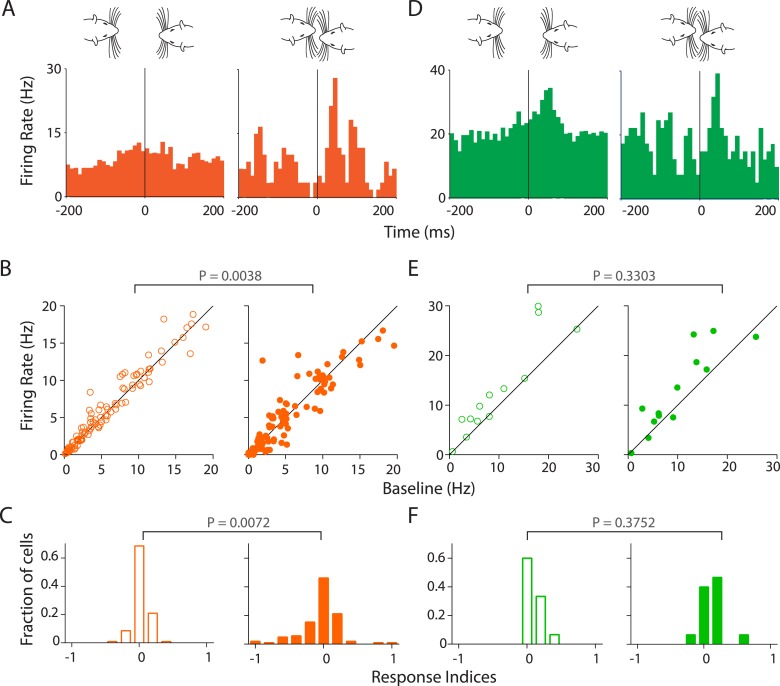
Figure 5. Stronger and variable modulation of responses to vocalizations by facial touch.
(A) Representative PSTHs of a RS neuron showing a stronger response to vocalizations during facial touch (right) compared to out of touch (left, bin size: 10 ms). (B) Population response of RS neurons also demonstrated an increased modulation to vocalizations (both excitation and inhibition) during touch (right) compared to outside of it (left), which were significantly different when subjected to a pair-wise comparison (Wilcoxon signed rank test). (C) Distribution of response indices showed that a large fraction of RS neurons were not modulated by vocalizations when out of touch (left) while a significant amount of modulation occurred during touch (right, Kolmogorov–Smirnov test). (D) Representative PSTHs of a FS neuron showing a higher response to vocalizations during touch (right) compared to the response when out of touch (left, bin size: 10 ms). (E) Population response of FS neurons however did not show any significant difference (Wilcoxon signed rank test) in modulation to vocalizations either in (right) or out (left) of touch. (F) Distribution of response indices in FS neurons also did not show any significant differences in modulation (Kolmogorov–Smirnov test) either in (right) or out (left) of touch.


