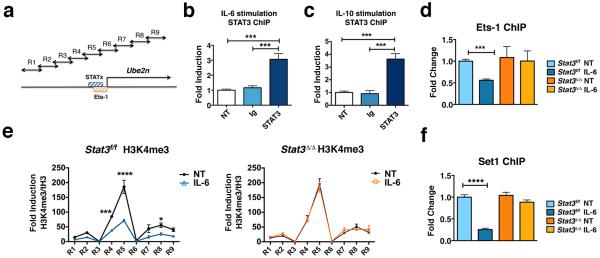
Figure 5. STAT3 represses Ube2n transcription by regulating Ets-1 association and H3K4me3 abundance at the proximal promoter.
(a) Schematic diagram showing the approximate location of the putative STATx (blue) and Ets-1 consensus sites (orange) and primers used for H3K4me3 ChIPs (arrows, sequences are listed in Supplementary Table I). (b and c) STAT3 association with the Ube2n promoter was measured by ChIPs from Stat3-sufficient bone marrow-derived macrophages in the absence (NT) or presence of IL-6 (b) or IL-10 (c) stimulation for 1 h, as indicated. IgG ChIPs were performed as control. (d to f) Bone marrow cells from Stat3f/f or Cre-ER Stat3f/f mice were cultured in M-CSF-containing media and 4-hydroxytamoxifen for 5 d to generate Stat3-sufficient (Stat3f/f) or Stat3-deficient (Stat3δ/δ) macrophages, respectively. Association of Ets-1 (d), H3K4me3 (e) or Set1 (f) with the Ube2n promoter in the vicinity of the STAT3 binding site (d and f) or the Ube2n proximal promoter (−/+ 1kb of TSS) (e) was measured by ChIPs, with (IL-6) or without (NT) IL-6 stimulation for 1 h, as indicated. ChIP primers for R5 were used for d and f. (b to f) Data represent mean values of 3 independent experiments. Error bars indicate SEM. Two-way Anova with Bonferroni multiple comparison used. *, p<0.05; **, p<0.01; ***, p<0.001; ****, p<0.0001 for the indicated comparisons.

