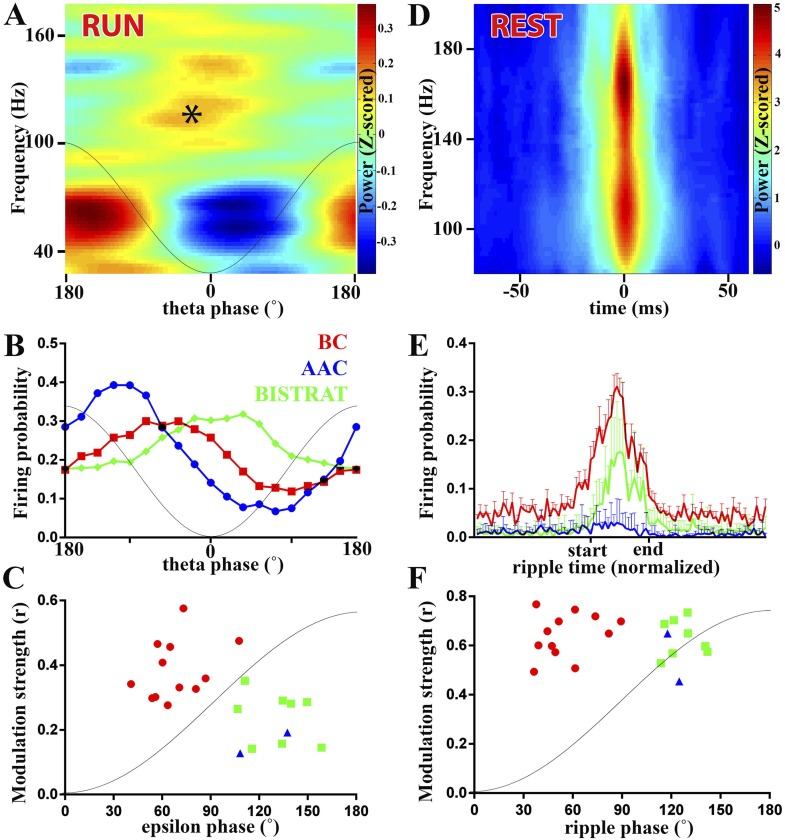
Figure 2. PV cell discharges during high-frequency (>90 Hz) oscillations associated with running or resting.
(A–C) Running-associated, theta-nested epsilon oscillations. (A) Averaged time–frequency plot triggered by theta troughs during running. A thin gray line representing a theta cycle is overlaid on the plots in panels A and B to illustrate the theta phases. Asterisk indicates the epsilon oscillations occurring during the late descending phase of theta. (B) Average firing probabilities of the 3 PV cell classes during theta oscillations. Note that the peak firing probability of BCs and Bistrat cells overlaps with the occurrence of epsilon oscillatory epochs (asterisk in panel A). (C) Preferred phase of firing and strength of modulation of discharges during epsilon oscillations (individual cells). A thin gray line representing half an epsilon cycle is overlaid on the plot to illustrate the epsilon phases. (D–F) Rest-associated ripples. (D) Time–frequency plot of detected ripples (90–200 Hz) during resting. (E) The mean firing probabilities of PV cell classes before, during, and after ripples (error bars: S.D.). (F) Preferred phase of firing and strength of modulation of discharges during ripple oscillations (individual cells). A thin gray line representing half a ripple cycle is overlaid on the plot to illustrate the ripple phases. Blue triangles: AACs, red circles: BCs, green squares: Bistrat cells.

