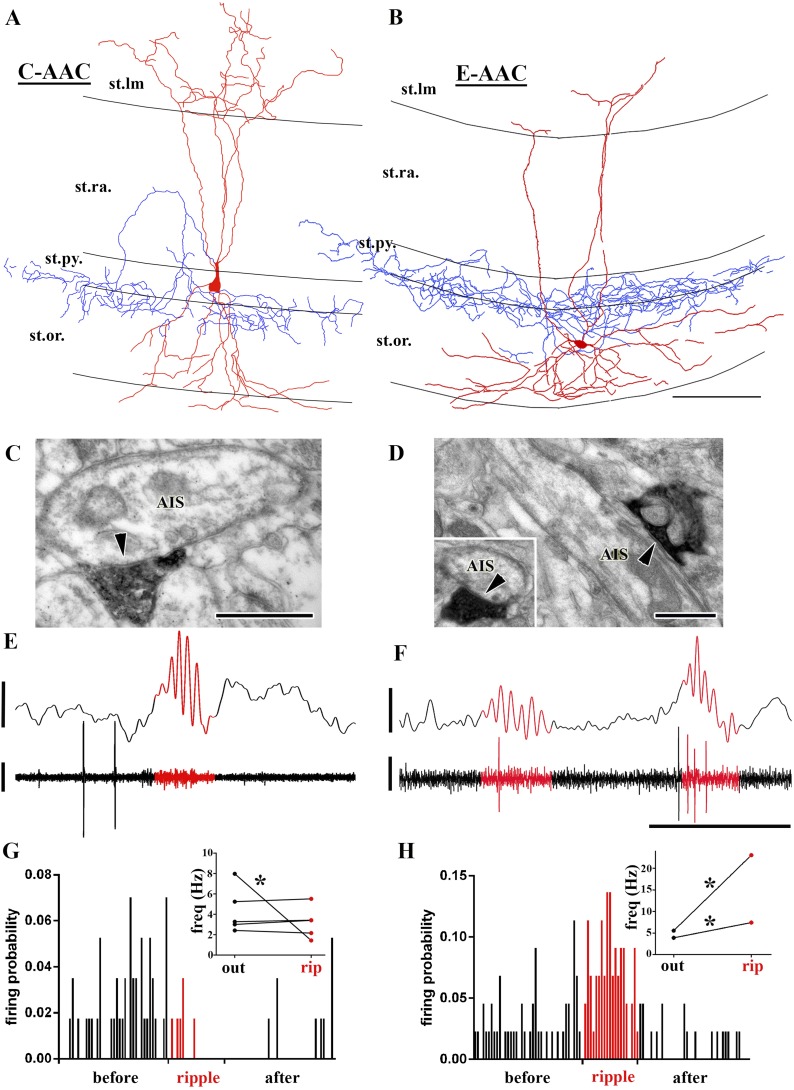
Figure 5. Sub-populations of AACs show distinct action potential discharge probabilities during ripples.
(A and B) Full reconstruction of dendritic arborizations and cell bodies of two representative AAC cells. Note that the cell body in (A) is located within stratum pyramidale (C-AAC), but the cell in (B) is in the stratum oriens (E-AAC; scale: 100 μm). (C and D) Electron microscopic verification of axon initial segments (AISs) as the exclusive post-synaptic targets of the axons of AACs in (A) and (B), respectively. The bouton in (C) innervates two adjacent AISs. Panel (D) also illustrates that targets were verified on longitudinally and transversely (inset) sectioned AISs (arrowheads in C, D: synaptic clefts, scales: 500 nm). (E and F) Example LFPs (upper traces) and the action potentials of cells shown in (A) and (B), respectively. Ripples are highlighted with red. Note the different firing activity of cell (A) and (B) during the events. Voltage scales: 0.5 mV; time scale: 100 ms. (G and H) Firing probabilities of cells in (A) and (B), respectively, as a function of normalized time before, during, and after ripples. Insets in (G and H): average firing frequencies of individual cells outside (‘out’; black dots) and inside (‘rip’; red dots) of ripple events. C-AACs (G, n = 5) did not change significantly their firing frequency during ripples; however, E-AACs (n = 2) showed elevated activity during events (statistical analysis as in Varga et al. (2012), based on randomization of spike times; see ‘Materials and methods’). Significance is indicated with asterisks (p < 0.05).

