


Figure 2.
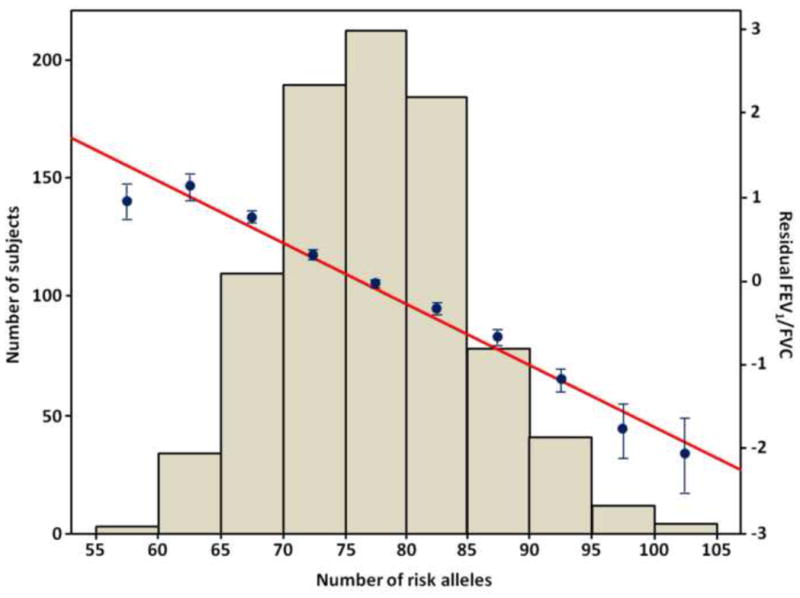
The combined effects of genotypes for 80 SNPs on the residual FEV1/FVC in the Hutterites. Hutterites were binned by their total number of alleles associated with reduced FEV1/FVC (x-axis); the mean (SE) residual FEV1/FVC for each bin is plotted on the right y-axis (blue dots and bars) and the number of subjects in each bin on the left y-axis. The linear regression line through these points is shown in red.