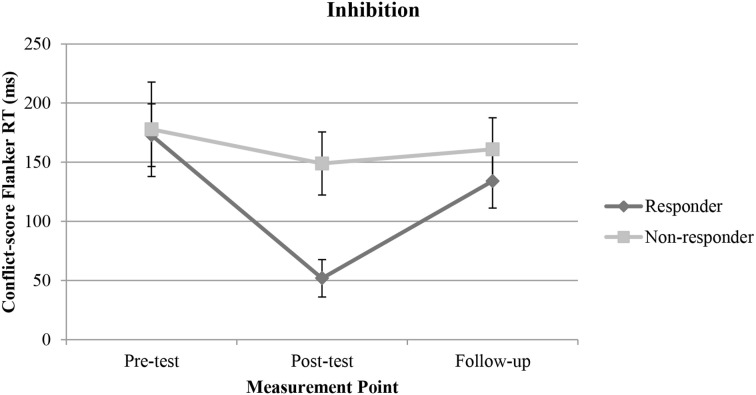
Figure 4.
Representation of means and error bars (representing standard error of the mean) for inhibition in the responder (subjects showing a cortisol elevation between pre- and post-test) and in the non-responder (subjects showing no or a negative change in cortisol level between pre- and post-test) group within the experimental group over the three measurement points (pre-test, post-test, follow-up). RT, reaction time.

