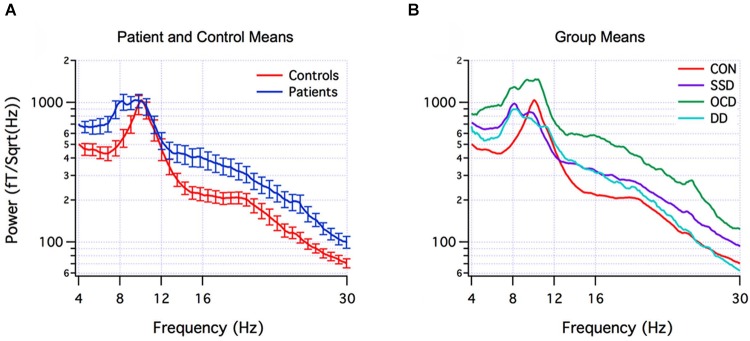
Figure 3.

EEG spectral signatures of healthy and psychiatric populations. (Panel A) Mean (± SEM) EEG power spectra of healthy control subjects (red) and psychiatric patients (blue). (Panel B) Mean subgroup spectra for controls (CON) (red, n = 18), schizophrenia spectrum disorder (SSD) (purple, n = 14), obsessive-compulsive disorder (OCD) (green, n = 10), depression disorder (DD) (light blue, n = 5). From Schulman et al. (2011).
