
Figure 8.
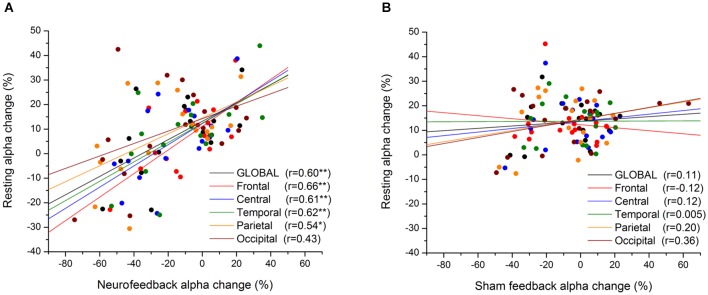
Short-term Hebbian plasticity following neurofeedback (NFB). Scatter-plot of mean alpha amplitude change across electrodes during feedback vs. resting state (post-feedback), for NFB (A) and SHAM (B) groups. The anatomical location of each subgroup of electrodes is represented by a different color (see legend). *p < 0.05, **p < 0.01. From Ros et al. (2013).