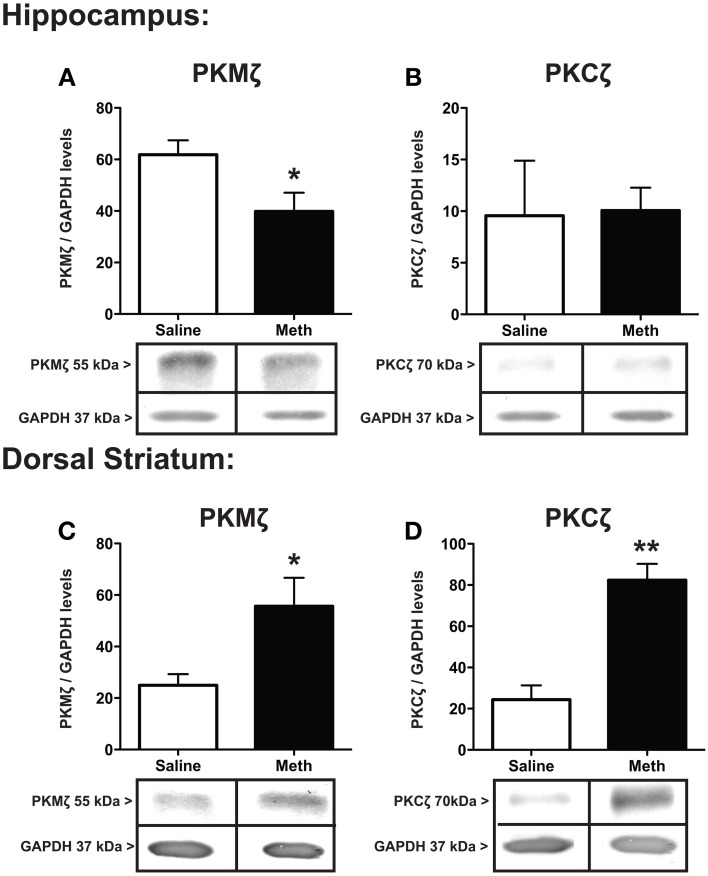
Figure 5.
Expression of PKMζ/PKC ζ. PKMζ and PKCζ in the hippocampus (A,B) and dorsal striatum (C,D) 7 weeks after the first injection of MA or saline. The hippocampus shows significant decrease in PKMζ with MA treatment (*p < 0.05) with a concomitant increase in the dorsal striatum compared to controls (*p < 0.05; A,C). PKCζ levels significantly increased in the dorsal striatum after MA treatment (**p < 0.01) but did not significantly change between conditions in the hippocampus (D,B).

