
Figure 3.
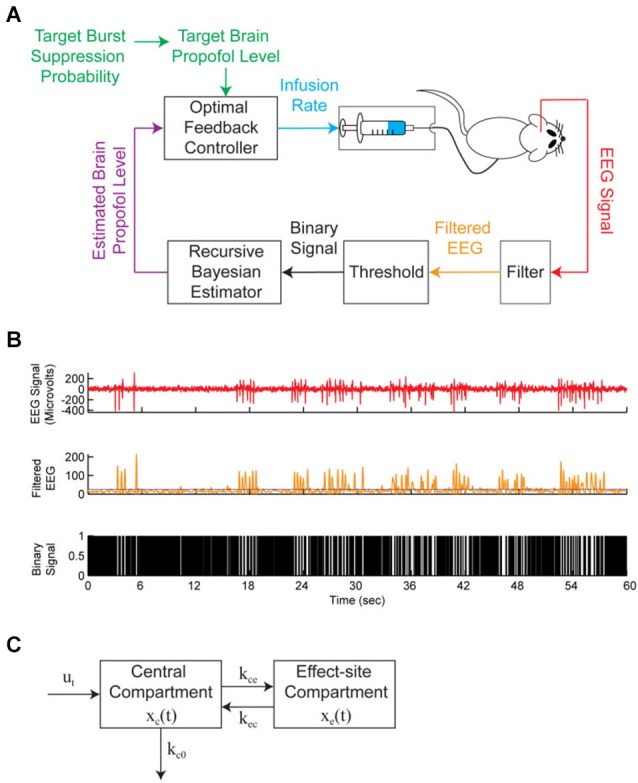
A brain machine interface (BMI) system to control propofol-induced burst suppression. (A) The BMI records the EEG, segments the signal into a binary time-series by filtering and thresholding, estimates the BSP or equivalently the effect-site concentration level based on the binary-time series, and then uses this estimate as feedback to control the propofol infusion rate. (B) A sample EEG trace showing burst suppression. The top panel shows the EEG signal, the middle panel shows the corresponding filtered EEG magnitude signal (orange) and threshold (blue) used to detect the burst suppression events, and the bottom panel shows the corresponding binary time-series with black indicating suppression events and white indicating burst events. (C) The two-compartmental model used by the BMI to characterize the effect of propofol on the EEG. The EEG was sampled at 500 Hz and the binary sequence was created by low-pass filtering the EEG at 5 Hz and thresholding. From (Shanechi et al., 2013b).