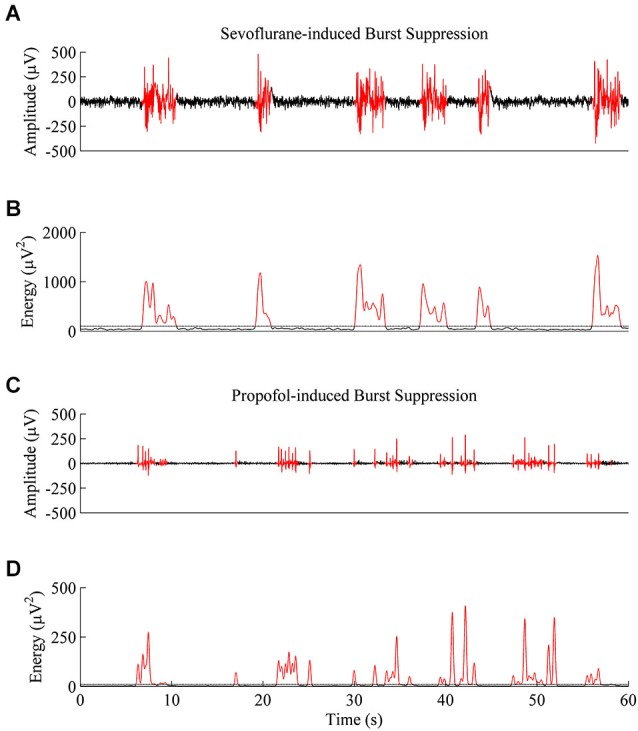
Figure 4.

Representative EEG traces and energy values from the same rat at a BSP of 0.7. (A) A 60-second EEG recording taken during sevoflurane-induced burst suppression. Black indicates an area threshold as suppression, and red indicates an area threshold as a burst. (B) Energy of the EEG trace from (A) that was used to segment bursts and suppressions. (C) 60-second EEG recording taken from the same animal during propofol-induced burst suppression. (D) Energy of the EEG trace from (C) shows that propofol-induced bursts and suppressions are shorter and lower in power then sevoflurane-induced bursts and suppressions, despite an equivalent BSP.
