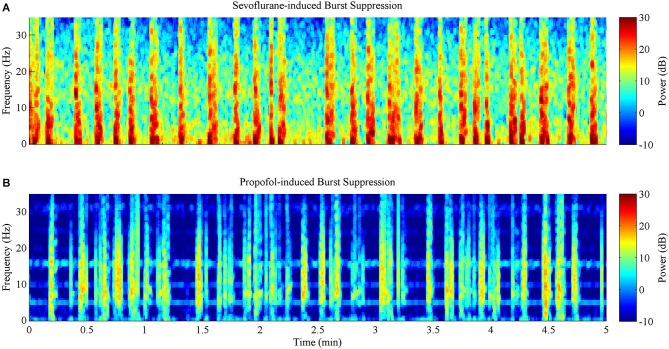
Figure 5.
Spectrograms computed from the same rat during 5 min of burst suppression at a BSP of 0.7. Warm colors indicate frequency components with high power, while cool colors indicate frequency components with low power. (A) Sevoflurane-induced burst suppression has high power between 1–10 Hz during bursts. (B) Propofol-induced burst suppression has lower power during bursts and suppressions across all frequencies when compared to sevoflurane.

