
Figure 1.
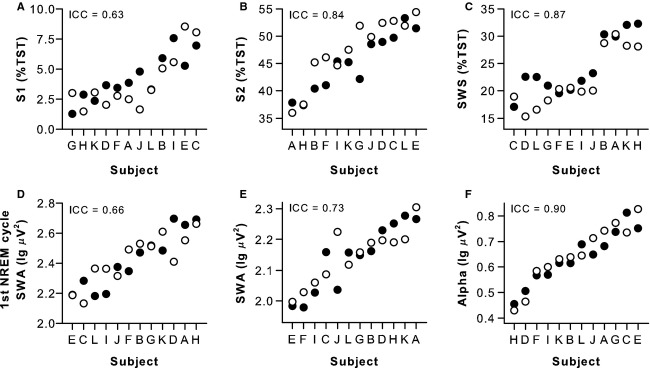
Individual differences in baseline sleep measures were stable across study visits. Sleep was assessed polysomnographically during two study visits spaced at least 2.5 months apart, with 8 h of time in bed for sleep scheduled at each participant's usual bedtime. Black circles show results for the first study visit, and open circles show results for the second study visit. Subjects (n = 12, A–L) are ranked from left to right according to their average response across study visits. Between‐subject differences in sleep staging results were reproducible for (A) Stage 1 sleep (S1), (B) Stage 2 sleep (S2), and (C) slow wave sleep (SWS), expressed as a percentage of total sleep time (TST). Individual differences in electroencephalogram (EEG) spectral power were stable across study visits for (D) slow wave activity (SWA) in the first NREM sleep cycle, (E) SWA during NREM sleep assessed across the entire sleep episode, and (F) alpha band activity during REM sleep. Results for EEG spectral analyses were obtained from the central derivation (i.e., average of C3–A2 and C4–A1). The intraclass correlation coefficient (ICC) is shown at the top left of each plot.