
Figure 4.
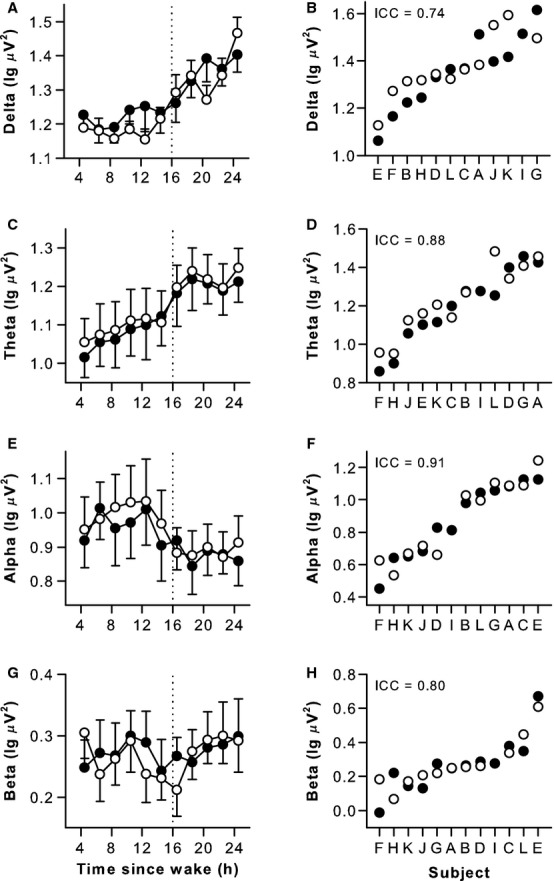
Individual differences in waking EEG spectral power during sleep deprivation were reproducible across study visits. During prolonged wakefulness, EEG spectral power in delta and theta frequency bands increased, and between‐subject differences were stable over repeated exposures (A–D). Alpha power decreased during the usual hours of sleep and beta power was lowest near bedtime. Individual differences in EEG alpha and beta activity were reproducible (E–H). Results are shown for the frontal EEG derivation. Black circles show results for the first study visit, and open circles show results for the second study visit. In panels A, C, E, and G, the mean ± SEM is shown. In panels B, D, F, and H, subjects (n = 12, A–L) are ranked from left to right according to their average response across study visits, and the intraclass correlation coefficient (ICC) is shown at the top left of each plot.