
Figure 5.
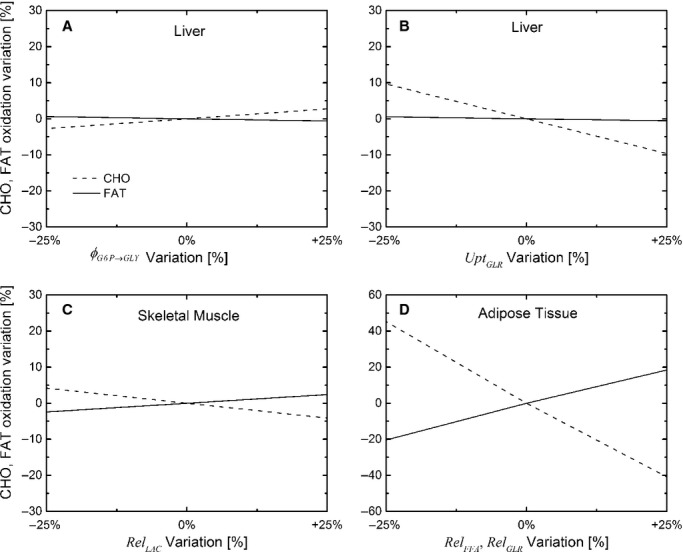
Sensitivity analysis. The effect of variation (±25% from the base case value) of ϕG6P→GLY in liver (A), UptGLR in liver (B), RelLAC, in skeletal muscle (C), and simultaneous variation (±25% from the base case value) of RelFFA and RelGLR in adipose tissue (D) on carbohydrate and fat utilization.