
Figure 1.
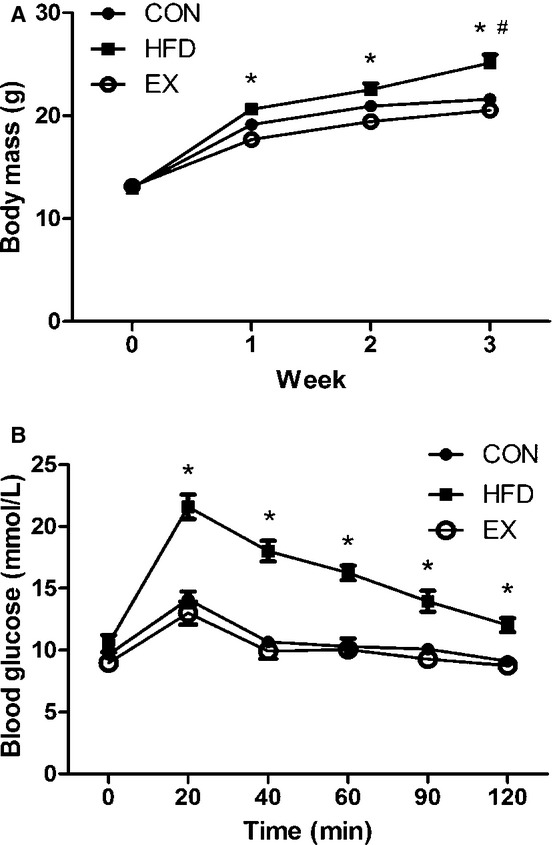
Body mass and glucose tolerance test. (A) Body mass of mice over 3 weeks (*HFD vs. EX, #HFD vs. CON, P < 0.05). (B) Intraperitoneal glucose tolerance test (*HFD vs. CON and EX, P < 0.05). Data are mean ± SEM, N = 5–6.
Official websites use .gov
A
.gov website belongs to an official
government organization in the United States.
Secure .gov websites use HTTPS
A lock (
) or https:// means you've safely
connected to the .gov website. Share sensitive
information only on official, secure websites.
Body mass and glucose tolerance test. (A) Body mass of mice over 3 weeks (*HFD vs. EX, #HFD vs. CON, P < 0.05). (B) Intraperitoneal glucose tolerance test (*HFD vs. CON and EX, P < 0.05). Data are mean ± SEM, N = 5–6.