Figure 4.

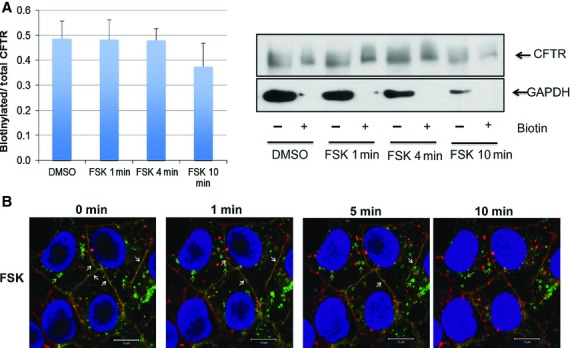
Effect of forskolin on the surface expression of CFTR. (A) Quantitation and representative blot of cell surface biotinylation of CFTR in HEK‐CFTR cells that were treated with forskolin (FSK; 10 μmol/L) for 1, 4, and 10 min. GAPDH was used as a control to determine if there was any contamination of biotinylated protein in the nonbiotinylated fractions (Ab: monoclonal mouse‐anti‐CFTR‐C and anti‐GAPDH; 1:1000 and 1:2000 dilution, respectively; estimated sizes: for CFTR: 165 kDa and GAPDH: 36 kDa). (B) Effect of FSK on CFTR location in live HEK‐CFTR cells. Cells grown in 35‐mm glass‐bottom dishes were stained as described in the Methods. Images were captured before and after the treatment of FSK as time series. Snapshots at 0, 1, 4, and 10 min are shown. Green: CFTR; red: WGA; and blue: Dapi. White arrows: colocalization of CFTR and WGA; green arrows: CFTR vesicles. n ≥3 for all experiments.
