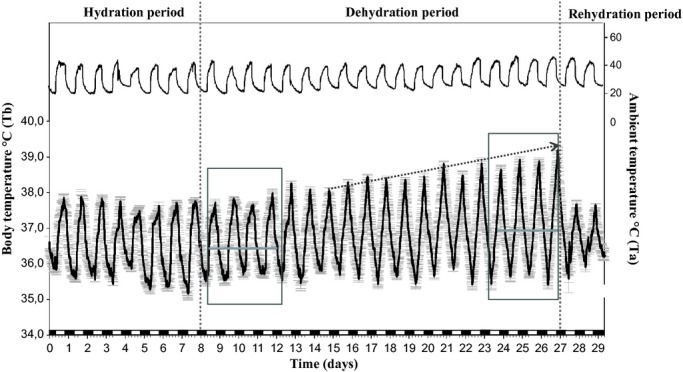
Figure 1.

Average rhythm of Tb of six camels in Experiment 1. Each data point corresponds to the mean (±SEM) of the six camels. Data were collected every 10 min for 29 consecutive days Tb rhythm (Black line down). Ta is represented by the upper curve. The vertical dotted lines separate the different periods of the experiment. The arrow shows the progressive increase of the amplitude of Tb rhythm after 7 days of water deprivation. Horizontal gray lines indicate the mean of Tb during the first (36.39°C ± 0.04) and last 4 days of dehydration period (36.95°C ± 0.05). The white and black blocks at the bottom of the figures denote the duration of the light and dark phases of the light–dark cycle, respectively.
